For international students
What you will learn
Data collection
Data analysis
Data interpretation
Data presentation
Description
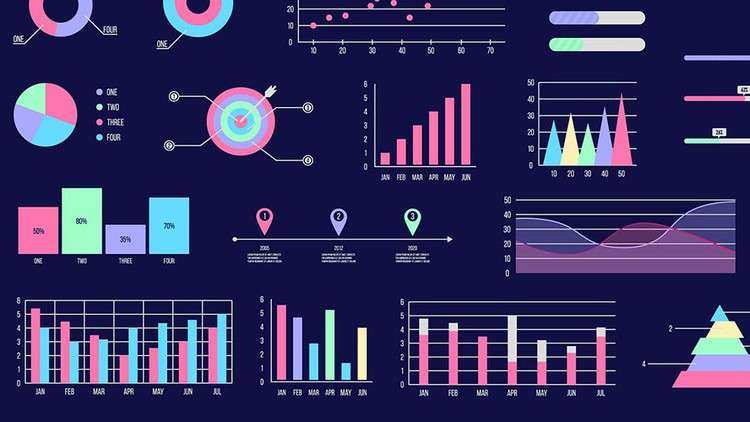
Data presentation/visualization
Presenting data is as important as collecting the intended data. This course will teach you how to present data using different Figures, Charts, Maps, Tables, and so on. This course will also teach you select the best possible figures to present your data, especially numeral data. In addition, you will learn how to use Excel or other software when you draw Figures and Tables if necessary.
The course is useful for both novice researchers and experts because it will teach you from A to Z of data presentation. This course is not only helpful for those who wish to write their thesis/dissertation but also for those who want to write research papers or publish any other research findings.
The instructor of the course is the author of a book series on “How to write research papers in English” in two volumes published by Amazon. The books were authored in a very simple language so that learners with an intermediate language proficiency can read the books. In addition, he is the author of a book on grammar entitled “Academic English Grammar: For intermediate and advanced learners” published by Amazon. Moreover, he is the editor of two books, one of which is also published by Amazon. For more info, be in touch with the instructor using social media.
N.B.: Some new lectures are being added gradually, and the course is being updated continuously.
Content