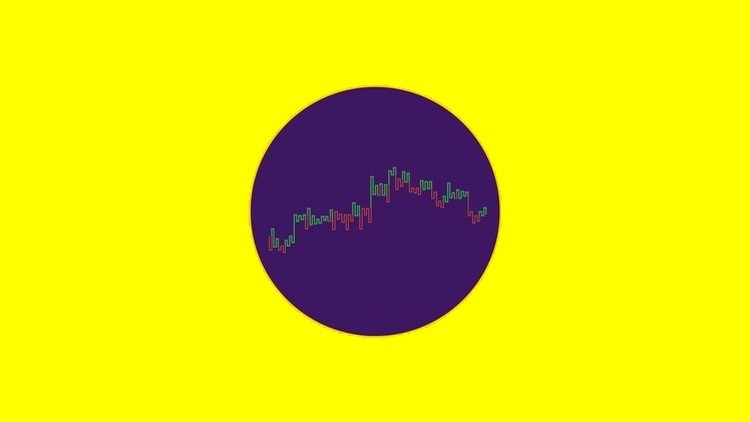
Kagi Chart reading is a Advance Stock Trading skill. Learn My Secret (Smiling Buddha) Strategy for Stock Trading as well
What you will learn
Master Advance Technical Analysis Chart like Kagi in terms of Stock Market
Master Smiling Buddha Stock Trading Strategy in terms of Kagi Chart
Understanding Kagi Charts Like a Professional Technical Analyst
Learn Kagi Chart from all Stock Trading Angles
Use little-known techniques to greatly reduce risk and maximize profits
Learn How is Kagi Chart Made?
Description
*** Course access includes quizzes & homework exercises, 1-on-1 instructor support and LIFETIME access! ***
Hear why this is one of the TOP-NOTCH Technical Analysis Course on Udemy:
Very interesting and unique technical analysis course which will help to make decisions. The instructor clearly explains how to achieve and what to be done.
-Hari Kishan
This is a concise course on the benefits of using Kagi charts as a positional trading confirmation tool. I learned a useful skill here.
-Natraj Jayaraman
Its a very new concept of charting/trading to me, but it looms absolutely interesting
-Michael Rowland
TOP-NOTCH Technical Analysis & Stock Trading Instructor
I currently have 71 Knowledge programs with 20,520+ Minutes of Content (342 hours in total) with 112,000+ Satisfied Students enrolled. That’s 14+ days of learning material!
I am currently mentioned in “Most Popular Instructors” tab on Udemy Business/Finance Section.
Technical Analysis & Stock Trading Course Details:
Kagi chart is a chart used for Following Price Trends and to make decisions According to long term trends in Stock Trading . Kagi Chart differs from traditional Stock Trading charts Example Candlestick chart as Kagi is independent of time.
Kagi charts were invented in the late 19th century in Japan for Trading Rice and was extremely Successful.
You cannot become a Expert Certified Financial Technician without learning Kagi charts.
Therefore this is your chance to learn a new Technical Analysis Skill. Kagi chart is a skill only used by Professionals & Now its your time to learn.
This Technical Analysis Course comes with a 30 day money back guarantee.
The Kagi chart is a chart used for tracking price movements and to make decisions regarding Buying or selling of stocks. It differs from traditional stock charts such as the Candlestick chart by being mostly independent of time.
This feature helps in producing a chart that reduces random Price noise.
Make Stock Market your darling and you will never see losses.
This course will teach you How Stock Trading Works & How to become a stock trading expert.
Disclaimer Note: This Technical Analysis & Stock Trading course is for educational and informational purposes only. Not recommending of any particular investments such as a particular stock or mutual fund.
Content