
Tableau for Finance: Visualize Financial Data using Tableau
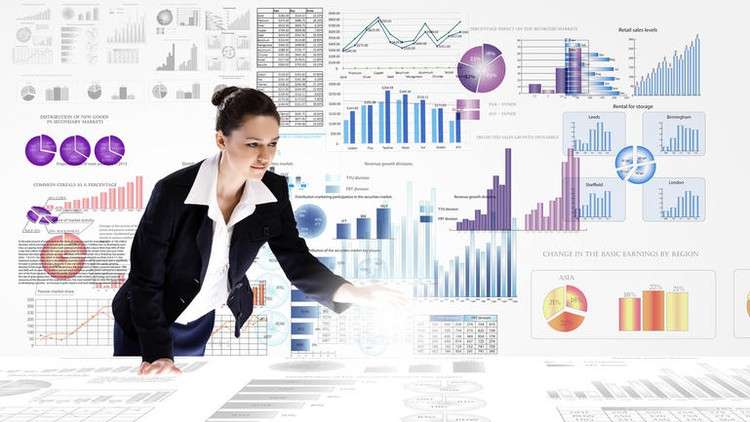
Learn to Analyze & Visualize Financial Data like a Pro with Tableau | Beginner-Friendly. Basic to Advanced level Tableau What you will learn Discover how…
Learn to Analyze & Visualize Financial Data like a Pro with Tableau | Beginner-Friendly. Basic to Advanced level Tableau What you will learn Discover how…
![Read more about the article [3-in-1] Data Viz Bundle: Tableau, Excel & Looker Studio](https://studybullet.com/wp-content/uploads/2023/05/3-in-1-Data-Viz-Bundle-Tableau-Excel-amp-Looker-Studio.jpg)
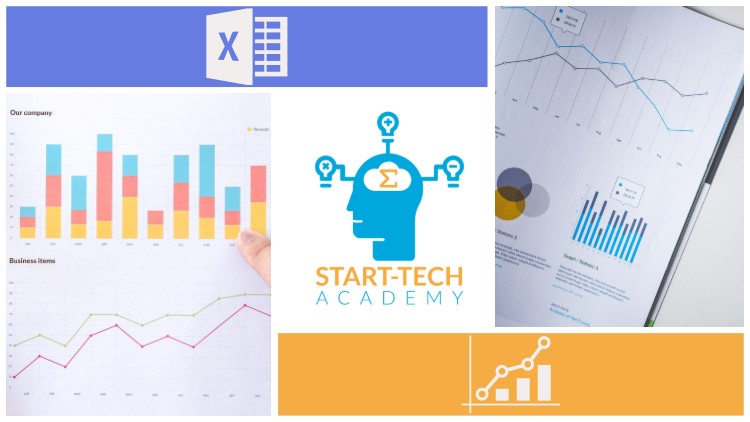
Learn and compare the three most used data visualization tools in one course- Tableau, Microsoft Excel & Google's Looker What you will learn Develop proficiency…

Learn advanced data visualization using the two most popular visualization tools - Tableau and Google's Looker What you will learn Master the basics of data…
![Read more about the article Become a Data Scientist: SQL, Tableau, ML & DL [4-in-1]](https://studybullet.com/wp-content/uploads/2023/04/Become-a-Data-Scientist-SQL-Tableau-ML-amp-DL-4-in-1.jpg)
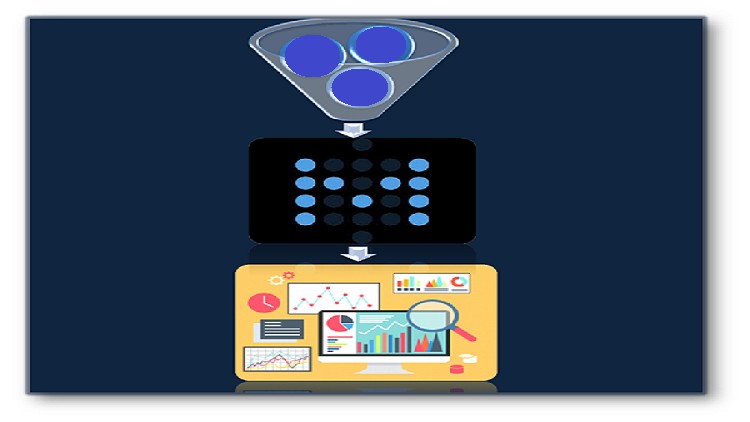
4-in-1 Bundle covering the 4 essential topics for a data scientist - SQL, Tableau, Machine & Deep Learning using Python What you will learn Develop…

Transform Raw Data into Powerful Insights with Step-by-Step Tableau Training for Beginners | Become a Tableau Pro What you will learn Recognize Tableau interface components,…
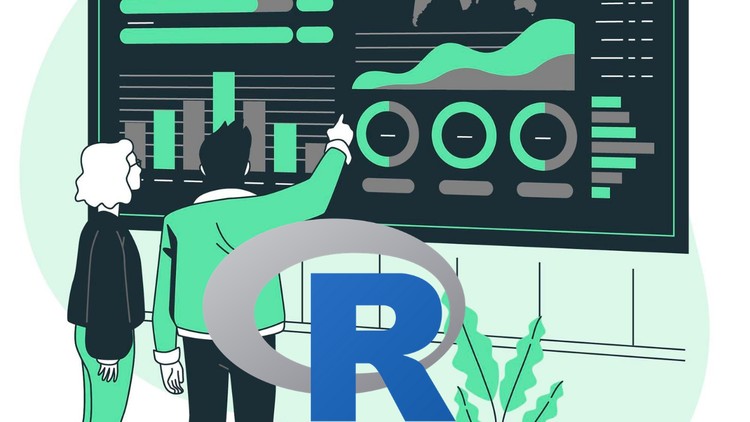
How to visualize data in R, understand ggplot2 package, data visualization tools in R, and project on Covid-19 analysis. What you will learn Deep understanding…

What you will learn Various Big Data Technology Fields Types of Big Data Technologies Big Data Technologies in Data Storage Big Data Technologies in Data…
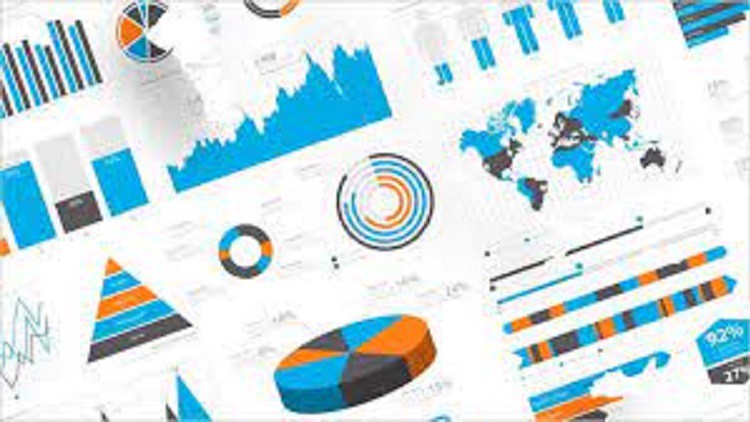
25+ Excel charts and graphs - Data Visualization in Microsoft Excel - visualizing data with Excel 2007- Excel 2019 What you will learn ☑ Learn…
Summarize, Analyze, and Visualize all types of data on PivotTable and PivotChart easily and effectively. What you will learn Build PivotTable or PivotChart from worksheet…
Learn attractive and informative statistical graphics and data visualization in Python Seaborn What you will learn There are a variety of skills that participants will…

Learn basics of seaborn , frequent used seaborn plots , styling in seaborn with the help of real-world use-cases What You Will Learn Learn about…
Learn to visualize data using Pyplot and master the Python Programming Language! What you will learn Have an intermediate skill level of Python Programming. Better…
Free & Opensource alternative to QlikSense, Tableau, Power BI & other proprietary BI tools What you will learn Metabase, a free Data visualization and BI…
Data Visualization What you will learn ☑ To discuss various tools used in data visualization ☑ Identify types of multidimensional visualization ☑ List and discuss…
An insight into Data Visualization Concepts, Display Media, Dashboards and Design Principles. What you will learn Students will understand importance of Data Visualization Tool Students…

An insight into Data Visualization Tool namely Google Data Studio What you will learn Students will understand how to use the Data Visualization Tool namely…