Way to Monitor SQL Server
What you will learn
SQL Server Monitoring Techniques for DBA or Developers or Managers
Free To learn & Free for Students and in Dev Environment
Check SQL server Health , Identify SQL server Bottleneck Root cause, RCA of any issue, Receive alerts on SQL Server or several issue to keep DB server healthy
Manage Organization SQL servers and Database , Find detailed report on Deadlock, Blocking, Expensive Query , Waits, Disk Latency
Description
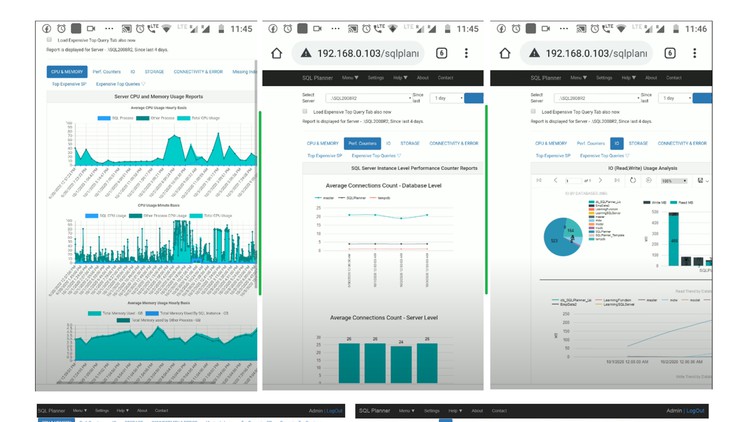
Learn the way to monitor Microsoft SQL server, the course is designed in such a way that helps in understanding Server performance, health , issues , root-cause instantly with fast deep level analytical reports using SQL Planner tool.
You would learn following to do after course completion :
– SQL Server Monitor , Analyze SQL server Health & find root-cause, receive alerts.
– find root cause of SQL server or database heavy usage
– Storage Analysis
– find root cause Waits
– find root cause Disk Latency
– Several Alerts
– Index Fragmentation Report
– Expensive Query or Procedure Report
– find root cause of deadlock and blocking
You can analyze your MS SQL server as it has following Metric report generation capability :
- CPU & Memory Usage reports : SQL process, Non SQL process and Total CPU Usage based on hourly aggregated and per minute wise.
- IO Usage Analysis : Overall IO Usage by Database , IO Usage by database logical database file , Read ,Write, Latency by DB wise
- Deadlock & Blockers analysis: Hourly Count , Duration by Database and object wise ,Details of victim Query and Root cause query session at granular level
- SQL Server Waits analysis: Perform SQL server Waits by Database , Wait Types and Query level
- Missing Index analysis
- Expensive Query and Procedure: Easily Generate Reports on expensive SQL Queries, Stored Procedure by overall wise , by IO , by CPU , by Application, by User, by Database etc.
- Storage analysis : Overall Disk Size utilized vs free space, Databases wise total size growth trend graph, Disk drive usage growth analysis trend
- Receiving Alerts : receive alerts when your server is down, when database data or log file exceeds to specific size, when CPU / RAM usage exceeds to specific threshold values, SPACE shortage, any word occurrence of errors/warning/terminate/dead in SQL error log found etc
- SQL Error Log Scan & Report : SQL server Error Log report based on error occurrence , Server connectivity failure or success report
- SQL Server Agent Job Analysis: SQL Server Agent Job Analysis by duration or historical check Alerts on failure or long running.
- Always On Monitoring: SQL Server Always On Live & Historical Dashboard to monitor All of AG Groups, Replica Health & Status from All Server. Alerts on failure or Sync Issue.
- Azure SQL DB Monitoring: Azure SQL DB or PAAS SQL DB complete Monitoring
- Handover Notes Management: DBA Handover Notes central management, tracking, editing in SQL Planner and same is Forwarded to Email as well
Content