Unlocking Insights: Advanced Data Visualization Techniques with Python
What you will learn
Note➛ Make sure your 𝐔𝐝𝐞𝐦𝐲 cart has only this course you're going to enroll it now, Remove all other courses from the 𝐔𝐝𝐞𝐦𝐲 cart before Enrolling!
Introduction to Matplotlib and its capabilities for creating various types of plots.
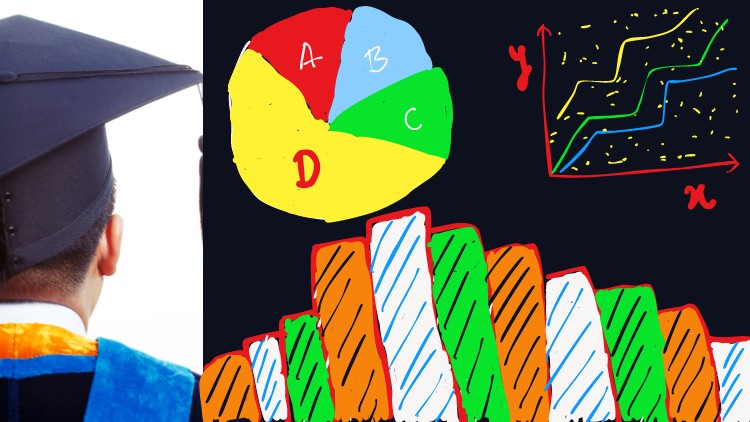
Plotting with Matplotlib: Line plots, Scatter plots, Bar plots, Pie Chart, Stack Plot and Histogram.
Customizing plots: Changing colors, Styles, Markers, and Line widths.
Adding Titles, Labels, and Legends to plots for better interpretation.
Working with multiple subplots and figures to create complex visualizations.
Saving plots in image formats (e.g., PNG) for publication or sharing.
Best practices for creating clear, informative, and aesthetically pleasing visualizations.
Practical examples and case studies demonstrating real-world applications of data visualization with Matplotlib.
English
language
Found It Free? Share It Fast!