Trade Linear Weighted Moving Average for consistent profits. This course includes all MT4 indicators ready to download.
What you will learn
Trade the Linear Weighted Moving Average strategy.
How to create a tradingplan.
Read and understand price charts.
Handle trading psychology.
Description
Trade the Linear Weighted Moving Average Trading strategy like a pro.
This course includes all MT4 indicators ready to download.
The Linear Weighted Moving Average (LWMA) is a popular technical analysis indicator used by traders to identify trends and potential trading opportunities in financial markets. It is similar to the Simple Moving Average (SMA), but it assigns more weight to recent price data points. Here’s a step-by-step guide on how to trade using the LWMA strategy:
- Understand the LWMA concept: The LWMA calculates the average price over a specified period, but it assigns more weight to recent prices. The formula for calculating the LWMA is: LWMA = (P1 * n + P2 * (n – 1) + … + Pn) / (n * (n + 1) / 2), where P represents the price data and n is the period.
- Determine the period: Decide on the period for your LWMA. This could be based on your trading strategy, time frame, and the financial instrument you’re trading. Shorter periods, such as 10 or 20, respond more quickly to price changes, while longer periods, like 50 or 200, provide a smoother average.
- Plot the LWMA on your chart: Calculate the LWMA values based on the selected period and plot the indicator on your price chart. Most trading platforms have built-in tools for calculating and displaying moving averages.
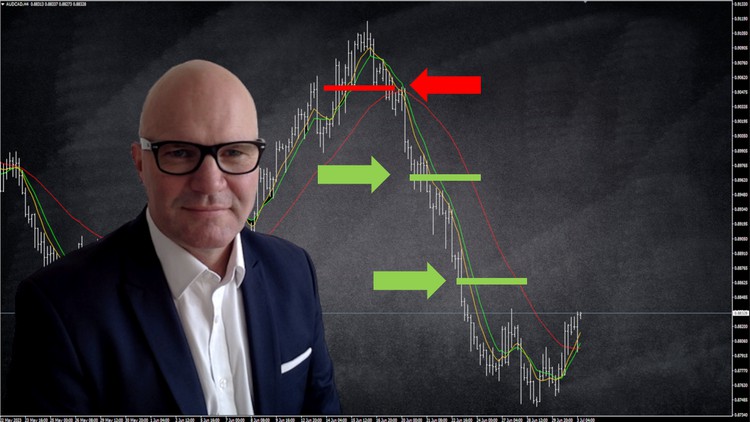
- Identify the trend: Determine the direction of the trend based on the relationship between the price and the LWMA. If the price is consistently above the LWMA, it indicates an uptrend. Conversely, if the price is consistently below the LWMA, it suggests a downtrend.
- Use crossovers for entry and exit signals: One common trading signal with LWMA is when the price crosses above or below the LWMA. When the price moves above the LWMA, it may signal a bullish trend, and when the price moves below the LWMA, it may indicate a bearish trend. Traders often use these crossovers as potential entry or exit points for their trades.
- Set stop-loss and take-profit levels: Determine your risk management strategy by setting appropriate stop-loss and take-profit levels. These levels help limit potential losses and secure profits in case the trade goes in your favor.
- Practice risk management: Apply proper risk management techniques, such as position sizing and risk-reward ratio analysis, to ensure that your potential losses are controlled and your potential gains are maximized.
- Backtest and optimize: Before implementing the LWMA strategy in live trading, backtest it on historical price data to evaluate its performance. Adjust the parameters, such as the period, and analyse the results to optimize the strategy for the specific market and timeframe you’re trading.
- Demo trade and monitor results: Once you’re satisfied with the backtesting results, implement the strategy in a demo trading environment to observe its effectiveness in real-time market conditions. Monitor the results, make any necessary adjustments, and refine your trading plan accordingly.
Remember that no trading strategy guarantees profits, and trading always involves risks. It’s essential to continuously learn, adapt, and evolve your trading approach based on changing market conditions and your own experience.
Content