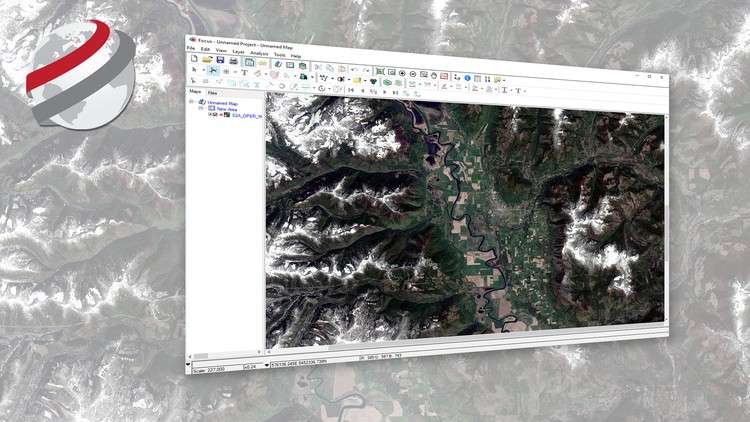
Geospatial Image Visualization with PCI Geomatics
Learn how to view geospatial imagery acquired from Earth observation satellites What you will learn How to visualize satellite imagery in its native distribution format…
Learn how to view geospatial imagery acquired from Earth observation satellites What you will learn How to visualize satellite imagery in its native distribution format…
![Read more about the article Learn SAP Lumira [Fast Track]](https://studybullet.com/wp-content/uploads/2024/05/Learn-SAP-Lumira-Fast-Track.jpg)
Learn how to create amazing informative visualizations and stories using SAP Lumira What you will learn Connect to different types of data sources (external, Database,…
Learn Excel for Business. Learn the most useful features of excel to develop business dashboards. What you will learn Data Visualization Pivot Tables Basic Excel…

Visually analyze each at-bat of a baseball game. What you will learn scrape PITCHf/x data into an R session plot pitch locations with ggplot visualize…
"Unlocking the Power of Data: A Comprehensive Guide to Building Dynamic Dashboards and Visualizations with Power BI" What you will learn How to use Power…

Free Guide For Compositing Architectural Visualization What you will learn Composite Photorealistic Architectural Visualization Work with Render Elements To use different modelling techniques To use…

Data Analysis and Data visualization in Python - Numpy, Pandas, Seaborn for Absolute Beginner. English language Requirements No introductory skill level of Python programming required…