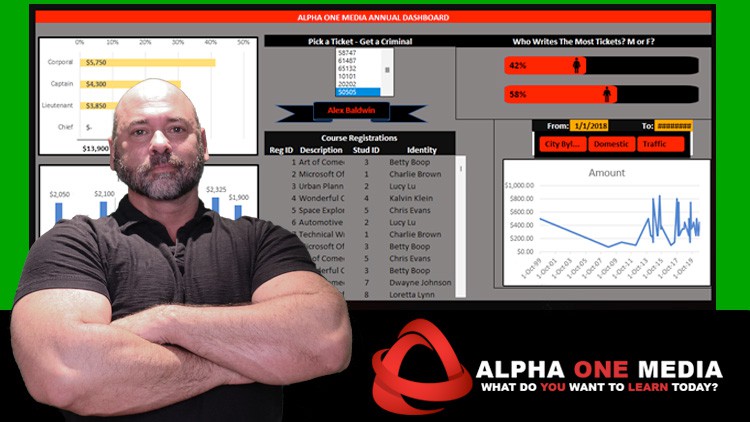
Learn to create interactive stunning visuals all from within Excel in this 2 hr crash course for Excel Dashboards!
What you will learn
Students will build their dashboard formula toolbox by adding functions they may not have known existed before.
Students will learn advanced charting skills and turn them inside out to full interactive responsive charts.
Students will experiment with various form controls and learn how they can control the charts they created.
Students will build a fully functional and interactive dashboard all within Excel without the need to learn another analytic tool.
Description
If you want those fancy dashboards, you see in Power BI, well guess what you can get them here in Microsoft Excel!
Using enhanced Excel functions such as INDEX, MATCH, IFS and many more, I will guide you use a simple Data List feature and form controls to pull out the important data from your tables using advanced functions and combine it with interactive and modified charts all from within Excel.
In this 2-hour crash course, we will cover:
- INDEX & MATCH
- IFS Functions
- LARGE vs SMALL
- CHOOSE
- Using Bar Charts as a whole vs Pie Charts
- Adding Dynamic Vertical Group Bars to Charts
- Making your Line Chart Dynamic to Date Ranges
- Creating your very first Info Graphics
- Using Option Buttons
- Using List Box
- Using Scroll Bar
- Create your Dashboard masterpiece
This course is intense, it’s fast, but it gets the job done. This course is designed for the Advanced Excel user who knows their way around functions and syntax and Excel in general. Although the manual you get with this course is eight chapters long, we only cover four of them in under 2 hours. So, you must know the first three chapters of the manual as well to be able to keep up with the content.
You may have heard of the functions we mentioned enough but you may not of known how their use can lead to stunning visuals and a dashboard all within Excel with no need to jump into Power BI!
Content