Unlocking Insights and Visualizing Trends for Informed Decision-Making
What you will learn
Proficient Data Manipulation: Acquire the skills to efficiently clean, organize, and manipulate raw data within Excel, ensuring accurate and reliable analysis.
Advanced Analytical Techniques: Learn to apply complex formulas, functions, and data analysis tools in Excel to uncover insights, trends, and patterns.
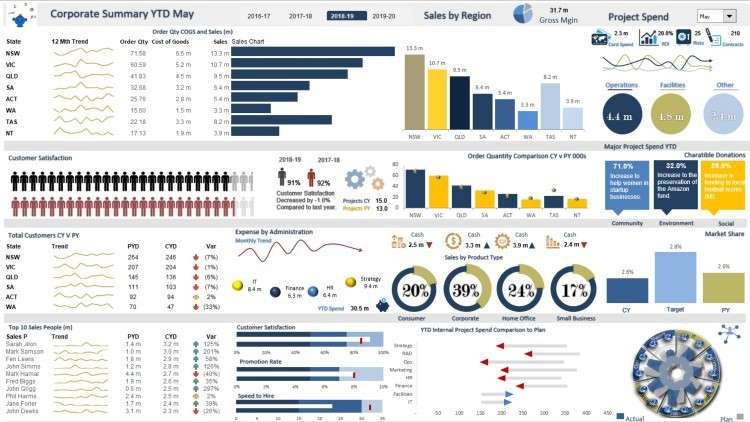
Dashboard Design and Visualization: Master the art of creating visually compelling dashboards, utilizing charts, graphs, and interactive elements .
Business-Ready Reporting: Develop the ability to synthesize your data analysis into actionable reports, presenting key findings and recommendations.
Description
Unlock the potential of Microsoft Excel with our comprehensive Excel Dashboard course. In today’s data-driven world, Excel stands out as one of the most powerful and widely-used data analysis desktop applications. Our course is designed to empower you with the skills to create dynamic and visually appealing dashboards, revolutionizing the way you present and interpret data.
An Excel dashboard serves as a centralized hub, showcasing a condensed overview of extensive data sets. Through the strategic utilization of elements such as tables, charts, and gauges, these dashboards offer an intuitive snapshot of critical information. By presenting key insights in a single window, dashboards streamline the decision-making process, enabling you to extract meaningful conclusions without drowning in raw data.
Our course delves deep into the art of crafting Excel dashboards that go beyond mere visuals. You’ll learn how to compile metrics and data points into a coherent narrative, revolutionizing the way you communicate insights. Excel dashboards offer a holistic view of essential metrics, transforming complex information into easy-to-understand charts and graphs that instantly capture attention.
From beginners seeking to enhance their Excel skills to seasoned professionals aiming to elevate their data analysis game, our course is tailored to all levels of expertise. Dive into the world of data visualization and manipulation with our hands-on modules that explore various tools, techniques, and functionalities. Whether you’re tasked with customizing reports, tracking metrics, or making informed decisions, our Excel Dashboard course equips you with the prowess to do so effortlessly.
Unleash the true potential of Excel and elevate your data analysis capabilities. Enroll now and embark on a transformative journey to master the art of creating engaging, insightful, and impactful dashboards. Your data has stories to tell – let Excel be your storyteller.
Content