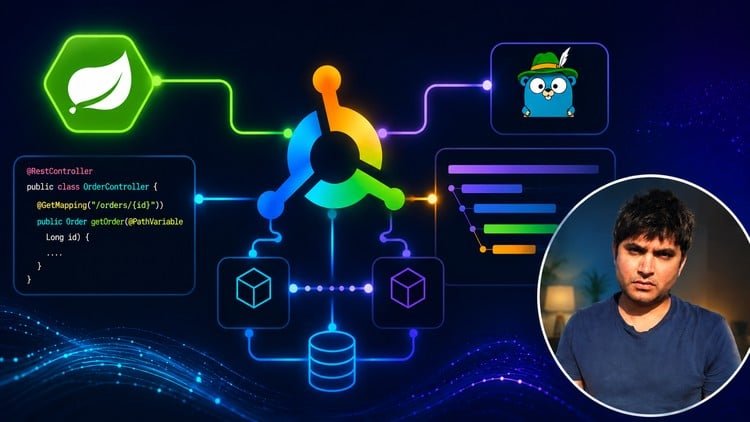
Build, trace, and understand a Java microservice from the ground up.
What You Will Learn:
- By the end of this course, the learner should be able to instrument a Spring Boot application with OpenTelemetry.
- Combining automatic agent-based instrumentation with manual spans.
- Trace requests end-to-end across multiple services using Jaeger.
- Explain how inter-service trace propagation works and why it helps diagnose issues in distributed systems.
The Reality of Modern Observability
If you’ve spent any time in the trenches of a microservices architecture, you know the specific brand of hell that is debugging a request that fails somewhere between service A and service D. In the old days, we’d crawl through fragmented logs, praying for a timestamp that matched up. But the industry has moved on, and OpenTelemetry (OTel) is now the undisputed industry-standard tool for making sense of that chaos. I recently sat through the ‘Hands-On OpenTelemetry with Java Spring Boot’ course, and honestly, it’s a breath of fresh air for anyone tired of the “black box” nature of distributed systems.
This isn’t just another theoretical snooze-fest. The course focuses heavily on real-world projects where you actually see the telemetry data flow. What I appreciated most was the focus on the “why” behind the signals. It’s one thing to attach a Java agent; it’s another to understand how context propagation actually stitches a broken narrative together across network boundaries. If you’re looking to achieve career growth in the DevOps or backend engineering space, mastering this level of visibility is no longer optional—it’s a requirement.
Prerequisites
Before you dive into the hands-on labs, you need to have your house in order. This isn’t a “Java for Beginners” course. To get the most out of this, you should have:
- Intermediate Java Proficiency: You should be comfortable with Java 11 or 17 and understand how the JVM works.
- Spring Boot Fundamentals: You need to know your way around Dependency Injection, Spring Web, and basic configuration properties.
- Docker Basics: Since you’ll be spinning up Jaeger and multiple microservices, knowing how to manage containers is essential.
- Basic Networking Concepts: Understanding HTTP headers and RESTful APIs will make the section on trace propagation much easier to digest.
Skills & Tools Covered
The course is surprisingly comprehensive, moving from beginner to advanced topics without losing the learner. You’ll spend most of your time in the IDE and the terminal, working with:
- OpenTelemetry Java Instrumentation: Both the “no-code” agent approach and the manual SDK for custom spans.
- Jaeger: The primary tool for visualizing distributed traces and identifying bottlenecks.
- Context Propagation: Learning how W3C Trace Context headers travel across the wire.
- Spring Boot Actuator: Integrating OTel with existing Spring metrics.
- Distributed Tracing: Linking spans across multiple service hops to see the “big picture.”
Career Benefits & Job Roles
Investing time in this course is a direct path to job-ready skills that high-paying tech companies are currently hunting for. As companies migrate to the cloud, the “Observability Engineer” is becoming a standalone role, and SREs (Site Reliability Engineers) who know OpenTelemetry can command significantly higher salaries.
By completing the real-world projects in this curriculum, you’re essentially preparing for certification prep in the cloud-native ecosystem (like the CKAD or various AWS specialty certs). This knowledge is relevant for:
- Backend Developers: Who need to move from “it works on my machine” to “I can prove why it failed in production.”
- Cloud Architects: Designing resilient systems that require end-to-end tracing for compliance and performance tuning.
- DevOps Engineers: Responsible for the health of the industry-standard tools and monitoring pipelines.
The Pros
- Manual vs. Automatic Balance: Many tutorials just show you the Java Agent and stop there. This course forces you to get your hands dirty with manual spans. This is crucial for career growth because, in complex enterprise apps, the auto-instrumentation often isn’t enough to capture specific business logic.
- Zero Fluff Labs: The hands-on labs are well-architected. You aren’t just copy-pasting code; you’re actually solving the “hidden” problems in a distributed system, which builds genuine job-ready skills.
- Visualizing the Win: There is a massive “aha!” moment when you see your first end-to-end trace in Jaeger. The course does a great job of setting up that payoff, making the learning curve feel rewarding rather than punishing.
The Cons
- Version Volatility: OpenTelemetry is an evolving standard. While the course is current, the OTel Java SDK changes rapidly. You might find that a specific dependency version in the hands-on labs requires a quick peek at the latest documentation to align with the very latest release. It’s a minor hurdle, but one that requires a bit of independent problem-solving.
Final verdict? If you want to stop guessing and start knowing how your Java microservices behave, this is an essential addition to your career growth toolkit. It bridges the gap between a beginner understanding of logs and an advanced mastery of cloud-native observability.