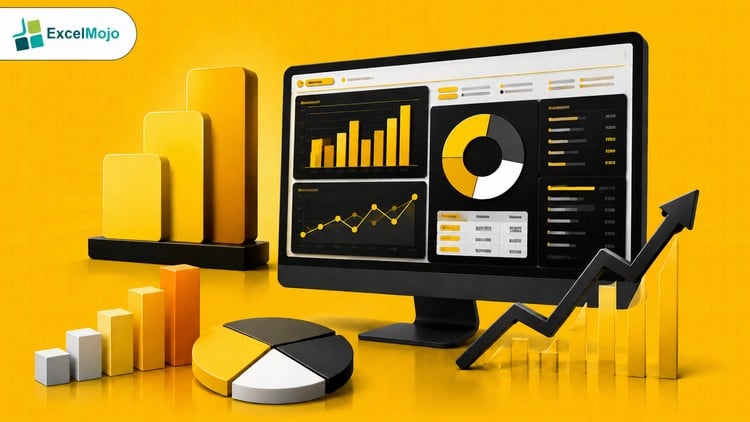
Learn Power BI reports, dashboards, DAX basics, data visualization, Query Editor, and business reporting workflows
What You Will Learn:
- Create professional reports and dashboards in Microsoft Power BI
- Learn Power BI Desktop and reporting workflows step-by-step
- Work with tables, matrix visuals, slicers, filters, and card visuals
- Build interactive dashboards and visual reporting experiences
- Create charts including bar, line, map, scatter, treemap, and ribbon charts
- Learn practical DAX formulas, calculated columns, and measures
- Understand relationships and data modeling basics in Power BI
- Transform and prepare data using Power Query Editor
- Publish reports to Power BI Service and build dashboards
- Connect Power BI with Excel and create reporting workflows
As an experienced tech professional who’s navigated the evolving landscape of data analytics for years, I’ve seen countless tools come and go. But Microsoft Power BI? That’s not just a trend; it’s a fundamental skill set for anyone serious about leveraging data in today’s business environment. The “Basic Power BI for Data Analysis & Reporting” course promises to equip you with foundational knowledge, and having gone through its curriculum and the outlined topics, I can confidently say it delivers a robust starting point. It’s pitched as basic, but it lays down a concrete runway for what quickly becomes an indispensable industry-standard tool.
Overview
Forget the dry, theoretical introductions you might find elsewhere. This course dives straight into the practical application of Power BI, making complex concepts digestible for newcomers. It’s not just about clicking buttons; it’s about understanding the “why” behind data visualization and reporting best practices. From the get-go, you’re encouraged to think like an analyst, not just a software operator. What truly stands out is the emphasis on building a comprehensive workflow – from connecting disparate data sources to publishing interactive reports that genuinely inform business decisions. It’s an immersive experience designed to transition you from a Power BI novice to someone capable of tackling genuine real-world projects with confidence, understanding the entire data lifecycle within the Power BI ecosystem.
Prerequisites
Given its “Basic” designation, the prerequisites for this course are refreshingly minimal, which is a huge plus. You don’t need to be a coding wizard or a data science guru. A fundamental understanding of Excel (tables, basic formulas) would be beneficial, but even that’s not strictly mandatory if you’re comfortable with logical thinking and navigating software interfaces. What you truly need is curiosity and a willingness to learn. If you’re coming from a background where you’ve struggled to extract meaningful insights from raw data, or if you’re simply looking to upgrade your reporting capabilities beyond static spreadsheets, you’re perfectly positioned to excel in this program.
Skills & Tools
Upon completing this course, you’ll possess a formidable arsenal of job-ready skills crucial for modern data roles. You’ll become proficient with Power BI Desktop, mastering its interface to connect to various data sources. A significant portion of your expertise will lie in the Power Query Editor, where you’ll learn to transform, clean, and shape raw data – a vital skill for data integrity. You’ll gain practical experience with essential DAX formulas, calculated columns, and measures, enabling dynamic calculations that unlock deeper insights. Moreover, the course meticulously covers data visualization principles, teaching you to create compelling reports and interactive dashboards using a variety of visuals: bar, line, map, scatter, treemap, and ribbon charts. You’ll also understand the basics of data modeling and relationships, ensuring your reports are accurate and scalable. Finally, you’ll be able to publish your creations to the Power BI Service, making your insights accessible and collaborative.
Career Benefits & Job Roles
Mastering Power BI opens up significant avenues for career growth across almost every industry. This course provides the foundational skills that are highly sought after by employers. Graduates will be well-prepared for roles such as:
- Data Analyst: Leveraging Power BI to unearth trends and present findings.
- Business Intelligence Developer: Building and maintaining reporting solutions.
- Reporting Specialist: Creating comprehensive and intuitive dashboards for stakeholders.
- Financial Analyst: Enhancing financial models and performance tracking.
- Marketing Analyst: Visualizing campaign performance and customer behavior.
The skills gained here are directly transferable and immediately impactful. While this course provides a strong base, it also acts as foundational certification prep for Microsoft’s official Power BI credentials, making you an even more attractive candidate in the competitive job market. It empowers you to not just consume data, but to actively shape narratives and drive data-driven decision-making within your organization.
Pros
- Hands-on & Practical Learning: The course is heavily geared towards hands-on labs and practical exercises, allowing you to apply concepts immediately. This reinforces learning effectively, ensuring you build job-ready skills that stick.
- Comprehensive for Beginners: For a “Basic” course, it covers an impressive breadth of topics, from data connection and transformation to advanced visualization and publishing. It ensures a holistic understanding of the Power BI workflow without overwhelming the learner, perfect for transitioning from beginner to advanced concepts.
- Clear & Structured Curriculum: The step-by-step approach is incredibly well-structured. Each module builds logically upon the last, preventing confusion and ensuring a smooth learning curve. This clarity is crucial for mastering industry-standard tools efficiently.
- Focus on Business Reporting Workflows: It doesn’t just teach features; it teaches *how* to use those features to solve actual business problems. Understanding these workflows is vital for anyone looking to make a tangible impact with their data analysis.
Cons
- Depth Limitations for Advanced Users: While excellent for beginners, those looking for very deep dives into highly complex DAX functions, advanced M query scripting, or large-scale enterprise data modeling techniques might find themselves needing a follow-up course. This course provides a solid foundation, but isn’t designed for expert-level mastery in *every* niche of Power BI.