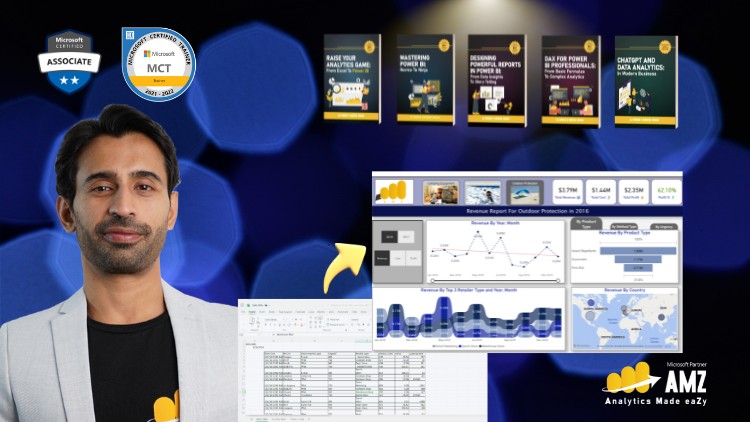
Mastering Data Analysis and Dynamic Visualizations with Microsoft Power BI – Recorded Live with Executives in Training.
What you will learn
Understand the basic features and functionalities of Power BI.
Acquire skills in importing data from various sources and transforming it for analysis.
Learn how to create simple visualizations like charts, graphs, and tables to represent data effectively.
Grasp the fundamentals of data modeling and relationships within Power BI.
Gain hands-on experience by working on practical exercises and projects that simulate real-world scenarios.
Lay the groundwork for more advanced topics in Power BI by understanding the essentials thoroughly.
Learn to publish and share report with stakeholders
Why take this course?
🚀 Mastering Data Analysis and Dynamic Visualizations with Microsoft Power BI 📊
Course Headline: Mastering Data Analysis and Dynamic Visualizations with Microsoft Power BI – Recorded Live with Executives in Training.
Your Journey to Business Intelligence Mastery Begins Here!
Welcome to a course that transcends the ordinary online learning experience. This isn’t just any video tutorial; it’s a recording of a live session, where you’ll learn alongside business executives and professionals, tackling real-world challenges with Microsoft Power BI. You’re not just watching a screen—you’re part of an interactive learning community!
🎓 Course Structure Overview:
Unit 1: Introduction to Business Intelligence 🌟
- Overview of Business Intelligence
- What is Business Intelligence and why does it matter?
- The transformative journey from data to actionable insights.
- How Power BI fits into the Business Intelligence process.
Unit 2: Understanding the Data Cycle 🔄
- Exploring the limitations of traditional tools like Excel
- Reviewing different licensing options in Power BI
- Navigating Pro vs Premium, and everything in between.
Unit 3: Data Transformation Techniques in Power BI 🔧
- Introduction to Power BI Query Editor
- Identifying common data issues and how to address them.
- Mastering data cleaning with step-by-step techniques:
- Removing columns and rows
- Setting the first row as header
- Changing data types, replacing values, removing spaces
- Handling errors, renaming, and optimizing steps
- Filling down missing values, splitting columns, removing duplicates
- Tips and tricks for automating data cleaning.
Unit 4: Data Modeling and Enrichment 🏗️
- Basics of data modelling and building relationships
- Understanding filter propagation and cardinality best practices.
- Introduction to data enrichment: Creating calculated columns and measures.
Unit 5: Basics of Data Visualization 🎨
- Familiarization with native and custom visuals in Power BI
- Hands-on creation of various charts (pie, line, bar), tables, and cards.
- Techniques for drilling down hierarchies and setting visual interactions.
- Formatting visuals and reports, including titles, legends, axes.
- Utilizing slicers and different levels of filtering.
- Applying conditional formatting to highlight important data points.
- Embedding images into reports for a personalized touch.
Unit 6: Publishing and Sharing Insights 🌐
- Steps to publish reports and set default user experiences
- Creating and managing workspaces for collaboration.
- Strategies for sharing reports effectively.
- Designing reports for mobile layouts for on-the-go insights.
What You’ll Gain:
✅ A Solid Foundation in Business Intelligence: Understand the process of transforming raw data into actionable insights with Microsoft Power BI.
✅ Expertise in Data Transformation: Learn to clean and prepare your data for analysis using Power BI’s Query Editor.
✅ Data Modeling Mastery: Build robust data models and enrich your data with calculated columns and measures.
✅ Advanced Visualization Skills: Create compelling visualizations that tell a story and engage your audience.
✅ Real-World Application: Share your findings with ease, whether in a report or through collaboration with colleagues.
By the end of this course, you won’t just be another Excel user; you’ll be a Business Intelligence professional ready to take on the world with Microsoft Power BI. 🌍💼✨
Enroll now and transform your data into stories that matter! 📈🔍
Alright, let’s talk about “Microsoft Power BI for Beginners & Excel Users.” I’ve navigated the choppy waters of data analytics for a while now, and if there’s one tool that’s become indispensable, it’s Power BI. This course, with its intriguing “Recorded Live with Executives in Training” tagline, immediately caught my attention. It suggests a focus on practical, business-driven application rather than just a dry technical tutorial, and thankfully, it delivers.
Overview
If you’re an Excel wizard feeling the limitations of static spreadsheets, this course is your much-needed upgrade. It’s not just about learning where the buttons are in Power BI; it’s about fundamentally shifting your approach to `data analysis` and `business intelligence`. The live executive training aspect really shines through, embedding a perspective that focuses on creating actionable insights, not just pretty charts. You’ll move beyond rows and columns into the realm of dynamic, interactive `data visualization` that can genuinely inform strategic decisions. It sets you up to leverage an `industry-standard tool` effectively, teaching you not just the ‘how’ but also a good chunk of the ‘why’ behind building powerful reports.
Prerequisites
Let’s be real, the course title isn’t misleading here. Your primary prerequisite is a solid working knowledge of Microsoft Excel. If you’re comfortable with VLOOKUPs, pivot tables, and generally manipulating data within spreadsheets, you’re in an excellent starting position. No prior Power BI experience is needed – it’s explicitly designed for `beginners`. What you do need, however, is a genuine curiosity about data and a readiness to transition from manual, time-consuming reporting to automated, interactive `executive dashboards`. A desire to elevate your `career growth` by acquiring new, highly sought-after `job-ready skills` is probably the most crucial pre-requisite, if you ask me.
Skills & Tools
This course meticulously guides you through the core functionalities of Power BI Desktop. You’ll master `data import` from various sources, moving beyond just Excel files to understand how to connect to databases or even web sources. A significant chunk of time is rightly dedicated to `data transformation` using Power Query – essentially the `ETL` (Extract, Transform, Load) process within Power BI. This skill alone is a game-changer for cleaning messy data. You’ll then dive into the fundamentals of `data modeling` and creating robust relationships between tables, which is critical for accurate analysis. Of course, `data visualization` is a highlight, teaching you to create compelling charts, graphs, and tables. Crucially, it covers `report publishing` and the best practices for `sharing with stakeholders`, ensuring your insights actually reach the right people. This foundational knowledge really sets the groundwork for diving into more `advanced topics` later on.
Career Benefits & Job Roles
In today’s data-driven world, Power BI skills are practically non-negotiable for a multitude of roles. This course arms you with immediate `job-ready skills` that enhance your marketability significantly. You’ll be well-prepared for roles such as a Junior/Mid-level Data Analyst, Business Analyst, Reporting Specialist, or even elevate your current position by becoming the go-to person for `business intelligence` within your team. For those looking ahead, this course provides an excellent springboard for more formal `certification prep`, like the Microsoft PL-300 exam. The ability to create dynamic `executive dashboards` and interactive reports is a huge boon for `career growth`, demonstrating a proactive approach to leveraging `industry-standard tools` for data-driven decision-making.
Pros
- Hands-on & Practical Focus: The “Recorded Live with Executives in Training” aspect isn’t just marketing fluff. The exercises and `real-world projects` are genuinely practical, designed to solve actual business problems. You’re not just learning theory; you’re applying it in scenarios relevant to `career growth`.
- Smooth Transition for Excel Users: This course perfectly bridges the gap for Excel veterans. It leverages familiar concepts while introducing Power BI’s superior capabilities, making the learning curve feel less steep and more intuitive. It’s a natural evolution of your `data analysis` toolkit.
- Comprehensive Foundation: From `data import` and `ETL` with Power Query to `data modeling`, `data visualization`, and `report sharing`, the course covers all the essential bases. It lays a very solid groundwork, making you competent in the core functionalities of this `industry-standard tool` right from the `beginner` level.
- Actionable Insights Mindset: The focus on executives implies an emphasis on creating reports that genuinely inform decisions. It encourages thinking about the audience and the message, rather than just the technical mechanics, which is vital for effective `business intelligence`.
Cons
- Limited DAX Depth: While excellent for beginners, the course, by its nature, only scratches the surface of DAX (Data Analysis Expressions). For complex calculations and truly advanced analytical models, you’ll definitely need to seek out dedicated resources to deepen your `DAX` knowledge. This isn’t a flaw for a beginner course, but it’s an honest expectation setting: it builds the foundation for more, rather than being an exhaustive masterclass in advanced formulas.