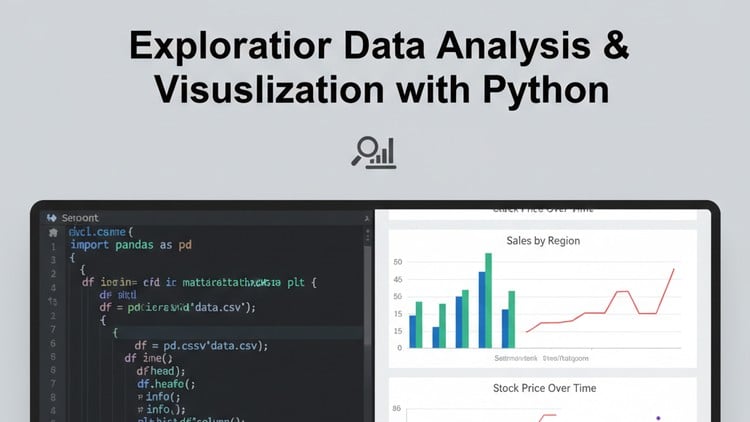
Master EDA & Data Visualization in Python: Cleaning, Statistical Analysis, Feature Engineering & Interactive Plots.
⭐ 4.13/5 rating
👥 2,135 students
🔄 September 2025 update
Add-On Information:
Note➛ Make sure your 𝐔𝐝𝐞𝐦𝐲 cart has only this course you're going to enroll it now, Remove all other courses from the 𝐔𝐝𝐞𝐦𝐲 cart before Enrolling!
- Course Overview
- Embark on a transformative journey into the heart of data science with ‘Exploratory Data Analysis & Visualization with Python’. This comprehensive course is meticulously designed to equip you with the essential skills to uncover hidden patterns, validate assumptions, and generate actionable insights from raw datasets. Moving beyond mere data consumption, you will learn to actively interrogate data, identify inconsistencies, and prepare it for advanced modeling or effective storytelling.
- Focusing on the powerful capabilities of Python, this program covers the entire spectrum of EDA – from initial data cleaning and rigorous statistical analysis to the sophisticated art of feature engineering and the creation of compelling interactive visualizations. You’ll understand not just how to use various tools, but why certain techniques are applied in different scenarios, fostering a deep, intuitive understanding of data exploration workflows.
- Whether your goal is to transition into a data-centric role, enhance your current analytical prowess, or simply gain a robust foundation for machine learning projects, this course provides a structured and practical pathway to mastering the critical initial phases of any data project.
- Requirements / Prerequisites
- Basic Python Familiarity: A foundational understanding of Python syntax, data types (lists, dictionaries), control flow (loops, conditionals), and function definition is highly recommended to fully grasp the concepts and examples.
- Algebraic & Statistical Foundations: While not strictly mandatory, a basic grasp of fundamental algebraic concepts and descriptive statistics (mean, median, standard deviation) will be beneficial. The course will refresh key statistical ideas as they become relevant.
- Comfort with Command Line / Jupyter Notebook: Basic experience navigating a command-line interface or working within a Jupyter Notebook environment will aid in setting up and executing code examples.
- Curiosity and Problem-Solving Mindset: The most crucial prerequisite is a genuine interest in working with data, an eagerness to solve real-world problems, and a commitment to hands-on learning.
- Skills Covered / Tools Used
- Data Cleaning & Preprocessing:
- Identifying and handling missing values (imputation, removal).
- Detecting and treating outliers using statistical methods.
- Managing duplicate entries and inconsistent data formats.
- Data type conversion and efficient data restructuring.
- Statistical Analysis with Python:
- Calculating and interpreting descriptive statistics (central tendency, dispersion, shape).
- Exploring data distributions (histograms, kernel density estimates).
- Understanding correlation and covariance between variables.
- Applying basic hypothesis testing concepts for data-driven decisions.
- Feature Engineering Techniques:
- Creating new features from existing ones to enhance model performance.
- Transforming variables (e.g., logarithmic, polynomial transformations).
- Encoding categorical variables (one-hot encoding, label encoding).
- Introduction to dimensionality reduction principles.
- Static & Interactive Data Visualization:
- Mastering Matplotlib for fundamental and customized plots.
- Leveraging Seaborn for high-level statistical graphics and aesthetically pleasing visualizations.
- Building interactive plots and dashboards with Plotly and an introduction to Dash, enabling dynamic data exploration.
- Crafting effective visual narratives to communicate complex data insights clearly.
- Core Python Libraries:
- Pandas: For robust data manipulation, analysis, and cleaning of tabular data structures (DataFrames).
- NumPy: For high-performance numerical operations and array computing.
- Scikit-learn (basic): Utilizing its preprocessing modules for scaling and encoding.
- Matplotlib, Seaborn, Plotly: The primary tools for static and interactive data visualization.
- Data Cleaning & Preprocessing:
- Benefits / Outcomes
- Proficiency in EDA Workflows: Systematically approach any dataset, from raw import to insightful conclusions, following industry best practices.
- Enhanced Data Literacy: Develop a critical eye for data quality, recognize potential biases, and understand the assumptions underlying various analytical techniques.
- Strong Foundation for Data Science: Solidify the foundational skills crucial for advanced machine learning, predictive modeling, and AI applications, as EDA is the bedrock of these fields.
- Effective Data Storytelling: Learn to transform complex data into clear, concise, and persuasive visual narratives that resonate with diverse audiences.
- Practical Portfolio Development: Gain hands-on experience through practical exercises and projects, enabling you to build a robust portfolio demonstrating real-world data analysis capabilities.
- Career Advancement: Position yourself competitively for roles such as Data Analyst, Business Intelligence Analyst, Junior Data Scientist, or significantly enhance your capabilities in any data-driven profession.
- PROS
- Comprehensive coverage of both fundamental EDA principles and advanced visualization techniques.
- Strong emphasis on practical, hands-on application using industry-standard Python libraries.
- Includes modern interactive visualization tools (Plotly), preparing learners for dynamic dashboard creation.
- Content updated to September 2025, ensuring relevance with the latest tools and practices.
- High student satisfaction rating (4.13/5) from a significant number of learners (2,135 students).
- Ideal for both beginners looking to enter data science and experienced professionals seeking to refine their EDA skills.
- CONS
- Requires dedicated practice and self-study beyond the core course material for true mastery and retention of all covered techniques and methodologies.
Learning Tracks: English,IT & Software,Other IT & Software
Found It Free? Share It Fast!