Visualization & Dashboard Design: Master Tableau & Power BI, Data Storytelling, and Advanced Reporting Techniques.
👥 18 students
Add-On Information:
Note➛ Make sure your 𝐔𝐝𝐞𝐦𝐲 cart has only this course you're going to enroll it now, Remove all other courses from the 𝐔𝐝𝐞𝐦𝐲 cart before Enrolling!
-
Course Overview
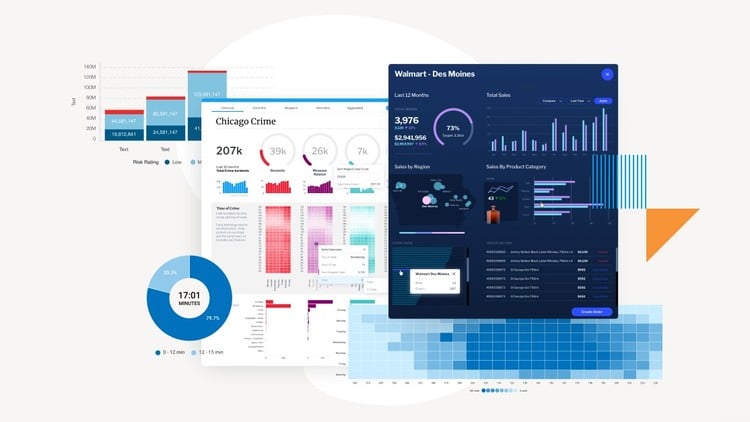
- The ‘Certified Data Visualization & Dashboarding’ course is an intensive program for professionals transforming complex data into clear, actionable insights. Focusing on mastery of Tableau and Power BI, the curriculum blends advanced dashboard design with critical data storytelling. A limited class size of 18 ensures personalized, hands-on learning and deep practical proficiency. This certification validates your ability to create sophisticated, interactive reports that drive strategic decision-making and enhance data literacy across organizations.
-
Requirements / Prerequisites
- Participants should possess a foundational understanding of data concepts and analytical thinking; prior exposure to basic data structures and spreadsheet software (e.g., Excel) is beneficial. While no formal degree is required, comfort with new software and a strong willingness to engage with real-world datasets and hands-on practice are crucial for success.
-
Skills Covered / Tools Used
- Dual Mastery in Tableau & Power BI: Achieve comprehensive expertise in both Tableau Desktop and Microsoft Power BI. Master Tableau’s data connection, advanced calculations, diverse chart types, and interactive dashboard creation. In Power BI, gain proficiency in Power Query for data transformation, Power Pivot for robust data modeling with DAX, and creating/publishing enterprise-grade reports. This dual-tool proficiency ensures versatility.
- Data Storytelling & Advanced Dashboard Design: Learn to craft compelling narratives from data by understanding audience, identifying key insights, and structuring visual stories to influence decisions. Explore best practices in dashboard layout, visual hierarchy, color theory, typography, and interactivity. Design intuitive, aesthetically pleasing, high-performance dashboards for rapid insight generation and effective communication.
- Data Preparation & Advanced Reporting Techniques: Develop essential skills in cleaning, shaping, and preparing raw data from multiple sources, including handling missing values, standardizing formats, and deriving new metrics. Beyond foundational reporting, explore advanced techniques like conditional formatting, dynamic parameters, drill-through capabilities, and implementing data governance for comprehensive, secure, analytical solutions.
-
Benefits / Outcomes
- Globally Recognized Certification & Career Acceleration: Earn the esteemed ‘Certified Data Visualization & Dashboarding’ credential, significantly boosting your professional profile and marketability in a high-demand global field. This certification positions you for accelerated career growth in pivotal roles like Data Analyst, BI Developer, and Data Visualization Specialist across various industries.
- Transformative Insight Generation & Communication: Acquire the powerful ability to translate complex datasets into clear, actionable visual insights, directly influencing strategic decision-making. Master data storytelling to effectively communicate findings to both technical and non-technical audiences, thereby driving business outcomes and fostering a data-driven culture.
- Develop a Compelling Professional Portfolio: Through rigorous hands-on projects and case studies, systematically build a robust portfolio of sophisticated data visualizations and interactive dashboards using both Tableau and Power BI. This tangible collection of your work serves as irrefutable evidence of your practical skills for prospective employers and clients.
-
PROS
- Comprehensive Dual-Tool Mastery: Provides in-depth, hands-on training for both Tableau and Power BI, equipping graduates with a highly versatile and sought-after skillset adaptable to any modern data environment.
- Personalized Expert Instruction: Limited class size (18 students) ensures significant one-on-one attention from experienced instructors, fostering a highly interactive learning environment and deep skill acquisition.
- Strategic Skillset for Impact: Beyond tool proficiency, the course emphasizes data storytelling and strategic reporting, enabling participants to not just present data, but to influence decisions and drive tangible business value.
-
CONS
- High Time Commitment: The comprehensive curriculum covering advanced concepts and two powerful tools requires a substantial time investment from participants for both classroom engagement and significant self-practice.
Learning Tracks: English,IT & Software,Other IT & Software
Found It Free? Share It Fast!