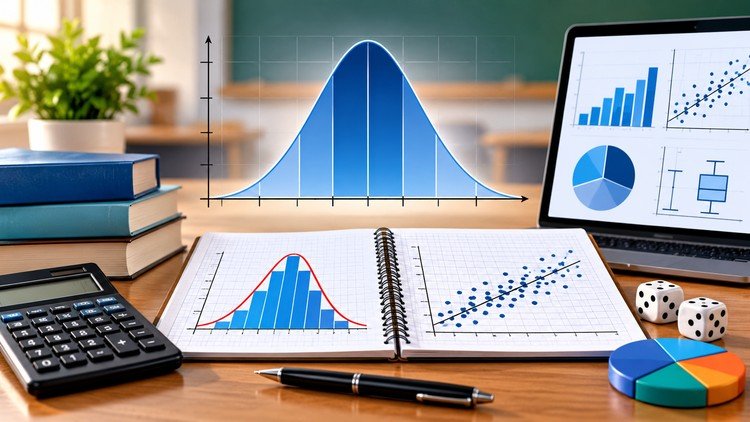
Master data analysis, graphs, averages, variability, z-scores, normal distributions, and probability step by step.
What You Will Learn:
- Analyze and interpret data using graphs, measures of center, measures of spread, and characteristics of distributions.
- Evaluate samples, identify bias, and make evidence-based statistical conclusions.
- Interpret z-scores and use the normal distribution to analyze and compare data.
- Calculate probability using complements, independent, dependent, AND, OR, and conditional events.
Overview
Alright, let’s talk about “Statistics Made Clear: High School Statistics & Probability.” My initial thought, seeing “High School” in the title, was “Is this really relevant for someone in the tech trenches?” But let me tell you, this isn’t just some remedial course. This is the bedrock, folks. Forget fancy algorithms; if you don’t grasp fundamental statistics and probability, you’re building your castle on sand. This course meticulously breaks down what you need to understand how data behaves, how to read between the lines of shiny dashboards, and how to spot a dubious claim. It’s a fantastic entry point, bridging the gap from zero knowledge to understanding why numbers matter in the real world. Think of it less as a high school subject and more as essential certification prep for anyone looking to truly understand data, from beginner to advanced analytical roles.
Prerequisites
The beauty of a “high school” level course is its accessibility. You’re not going to need a computer science degree or advanced calculus here. If you’ve got a decent grasp of basic algebra—solving for X, understanding percentages—you’re golden. No prior statistics knowledge is assumed, which is exactly what you want for a foundational course. Don’t worry about needing specific industry-standard tools like Python or R just yet; the focus is on the concepts, where everyone should start before diving into coding libraries.
Skills & Tools
This course arms you with some seriously powerful job-ready skills, even if the tools themselves are primarily conceptual or calculator-based. You’ll master:
- Data Interpretation & Analysis: Moving beyond just looking at numbers to understanding what they *mean*. Crucial for any real-world projects.
- Measures of Center & Spread: Averages, medians, standard deviation – understanding how to summarize and characterize data distributions is fundamental.
- Probability Calculations: From basic complements to conditional probabilities, you’ll learn the language of chance. Invaluable for risk assessment and predictive modeling.
- Bias Identification & Critical Thinking: Perhaps the most underrated skill taught. Learning to evaluate samples, identify biases, and make evidence-based statistical conclusions is paramount.
- Z-scores & Normal Distribution: Your keys to comparing datasets and understanding likelihood. Absolute must-knows.
While it doesn’t teach specific software like SQL or Python, the conceptual framework it builds is directly transferable to applying these concepts using those very industry-standard tools.
Career Benefits & Job Roles
If you’re wondering how “High School Statistics” translates into tangible career growth, let me connect the dots. Every single role dealing with data, from basic administration to a cutting-edge Machine Learning Engineer, relies on these foundational statistical principles.
- Data Analysts: Lays the groundwork for understanding the data you’ll clean, transform, and visualize daily.
- Business Intelligence (BI) Professionals: Interpreting dashboards and metrics? You’ll need these skills to tell a compelling, accurate story.
- Market Researchers: Understanding survey data, sampling, and making generalizations? Essential.
- Aspiring Data Scientists/ML Engineers: This is your absolute first step. You can’t effectively build models if you don’t understand variance, distributions, and probability. Crucial for understanding model performance and limitations.
It’s not just about specific job titles; it’s about developing a data-literate mindset highly valued across *any* industry. This course truly builds job-ready skills for future learning and real-world application, acting as crucial certification prep for more advanced analytical certifications.
Pros
- Exceptional Clarity & Foundation: “Made Clear” isn’t fluff. It excels at demystifying complex topics, making them digestible and truly understandable for a beginner to advanced learning path.
- Strong Emphasis on Critical Thinking: I particularly appreciate the focus on identifying bias and making sound, evidence-based statistical conclusions. This isn’t just about crunching numbers; it’s about understanding their implications and limitations – a critical skill for any tech professional.
- Practical & Relevant Topics: The core topics covered are directly applicable to understanding data in everyday life and, more importantly, in most entry-level data roles and beyond for real-world projects.
- Future-Proofing Your Learning: By establishing such a solid theoretical base, this course dramatically eases the transition into more advanced subjects like machine learning or data science, where underlying statistical concepts are paramount.
Cons
- Limited Hands-on Tool Experience: My one honest beef is that while it builds an incredible conceptual foundation, it doesn’t really get into applying these concepts using modern industry-standard tools like Python, R, or even advanced Excel functions. For pure conceptual understanding, it’s perfect, but for truly rounding out those job-ready skills, you’ll definitely need to pair this with a course focused on practical application in hands-on labs with specific tools. Don’t expect to code a regression in Python from this alone.