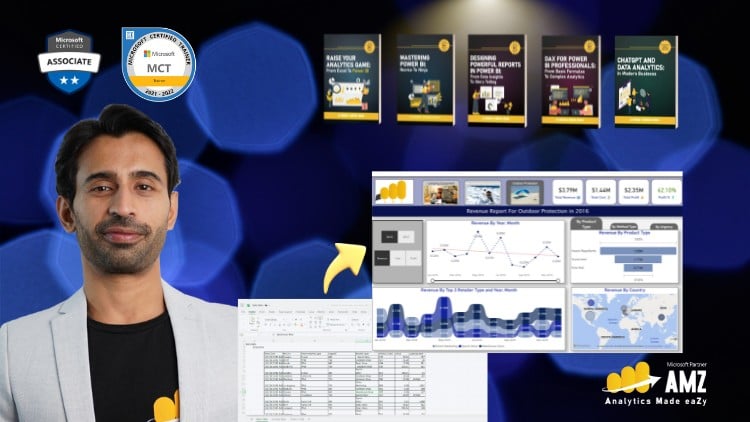
Mastering Data Analysis and Dynamic Visualizations with Microsoft Power BI – Recorded Live with Executives in Training.
⏱️ Length: 4.5 total hours
⭐ 4.52/5 rating
👥 27,835 students
🔄 September 2025 update
Add-On Information:
Note➛ Make sure your 𝐔𝐝𝐞𝐦𝐲 cart has only this course you're going to enroll it now, Remove all other courses from the 𝐔𝐝𝐞𝐦𝐲 cart before Enrolling!
- Course Overview
- This introductory course seamlessly transitions Microsoft Excel users and beginners into modern business intelligence using Power BI, elevating your analytical capabilities beyond static spreadsheets.
- Leveraging a “Recorded Live with Executives in Training” format, the curriculum provides practical, business-relevant insights, ensuring direct applicability to real-world decision-making challenges.
- Discover how Power BI transforms raw data into dynamic, interactive visualizations, effectively uncovering trends and communicating complex information. Move from simple reports to compelling data stories.
- Build a robust foundation in data analytics, cultivating an analytical mindset to leverage technology for extracting maximum value from organizational data, enhancing reporting efficiency.
- Learn to integrate Power BI with your existing Microsoft Excel skills, augmenting them with advanced capabilities for larger datasets and automated reporting workflows.
- Explore the basic lifecycle of business intelligence, from connecting diverse data sources to crafting polished, shareable reports and dashboards that update effortlessly.
- Requirements / Prerequisites
- A fundamental understanding of working with data in spreadsheet applications, like Microsoft Excel, is beneficial for quicker comprehension.
- Access to a Windows 10+ computer is necessary, along with the ability to install the free Power BI Desktop application for hands-on exercises.
- Basic computer literacy, including file navigation, is expected for a smooth and productive learning experience.
- No prior business intelligence or Power BI experience is required; this course is specifically designed for absolute beginners.
- A genuine curiosity for data analysis and a desire to enhance reporting and visualization skills are the most important prerequisites.
- Skills Covered / Tools Used
- Strategic Data Sourcing: Learn effective methods for identifying and connecting to various data sources (e.g., local files, conceptual databases) to gather information for robust analysis.
- Data Preparation & Transformation Basics: Master initial data cleanup, shaping, and structuring techniques within Power BI’s Power Query Editor to ensure data quality and analytical readiness.
- Fundamental Data Modeling: Understand how to establish appropriate relationships between different data tables, creating an integrated data model for comprehensive analysis.
- Introductory DAX for Measures: Gain initial exposure to Data Analysis Expressions (DAX) by writing simple calculated columns and basic measures, enriching your data with new insights.
- Interactive Report & Dashboard Creation: Develop visually engaging and dynamic reports using diverse visualization types, incorporating filters, slicers, and drill-through features.
- Effective Data Storytelling: Cultivate the ability to arrange visuals and text to construct a clear, compelling narrative, guiding your audience through key data insights.
- Tools: The course extensively utilizes Microsoft Power BI Desktop for all practical data connection, transformation, modeling, and visualization activities.
- Benefits / Outcomes
- Enhanced Professional Standing: Elevate your resume and career prospects by acquiring a highly sought-after skill in modern data analytics.
- Automated & Efficient Reporting: Significantly reduce manual reporting efforts by setting up automated data refreshes and dynamic dashboards, freeing time for strategic analysis.
- Informed Decision-Making: Empower yourself and your organization with robust, interactive data insights, leading to more strategic planning and operational effectiveness.
- Uncover Actionable Insights: Move beyond surface-level observations to identify hidden trends, patterns, and opportunities within your datasets.
- Persuasive Data Communication: Enhance your ability to present complex data findings clearly and persuasively, influencing stakeholders and driving consensus.
- Solid Analytical Foundation: Establish an essential groundwork for exploring more advanced Power BI functionalities and other data science tools.
- Become an Internal Data Expert: Position yourself as a go-to resource for data insights, transforming raw numbers into strategic advantages for your team.
- PROS
- Real-World Context: “Recorded Live with Executives” provides practical, high-value business scenarios directly applicable to professional environments.
- Proven Quality: A 4.52/5 rating from over 27,000 students attests to the course’s effectiveness and high satisfaction.
- Up-to-Date Curriculum: The September 2025 update ensures you learn the latest features and best practices in Power BI.
- Beginner-Friendly Approach: Specifically designed to ease Excel users and newcomers into Power BI without prior BI experience.
- Concise Learning Path: At 4.5 total hours, it delivers foundational knowledge efficiently for busy professionals.
- CONS
- This foundational course provides an excellent starting point, but achieving mastery and exploring advanced Power BI capabilities will require dedicated ongoing practice and further learning.
Learning Tracks: English,IT & Software,Other IT & Software
Found It Free? Share It Fast!