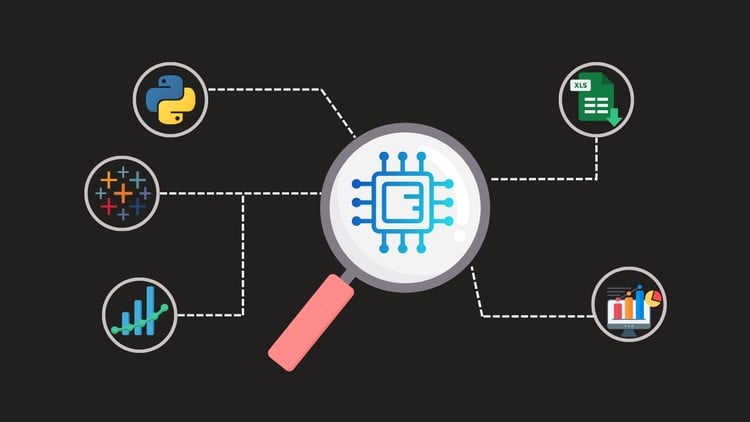
A beginner-friendly data science course covering Excel, Python, Tableau, and statistics with real-world projects.
What you will learn
Analyze and visualize data in Excel using pivot tables and charts.
Write Python scripts for data manipulation with Pandas and NumPy.
Perform statistical analysis and hypothesis testing with ease.
Create interactive dashboards and visualizations in Tableau.
Clean, organize, and prepare datasets for analysis.
Understand key statistical concepts for data-driven decisions.
Use Python libraries like Matplotlib and Seaborn for visualization.
Integrate Excel, Python, and Tableau for seamless data workflows.
Apply real-world data analysis techniques to projects.
Build confidence as a data science professional from scratch.
Add-On Information:
Note➛ Make sure your 𝐔𝐝𝐞𝐦𝐲 cart has only this course you're going to enroll it now, Remove all other courses from the 𝐔𝐝𝐞𝐦𝐲 cart before Enrolling!
- Strategic Tool Integration: Develop a nuanced understanding of when to leverage Excel for initial data exploration, Python for advanced manipulation and automation, and Tableau for dynamic storytelling, fostering an adaptive problem-solving approach.
- Bridging Foundational Gaps: Demystify core data science concepts, translating complex statistical theories into practical applications without overwhelming jargon, ensuring a solid conceptual bedrock for future learning.
- End-to-End Data Storytelling: Master the art of transforming raw, disparate datasets into compelling narratives, learning to identify key insights and communicate them effectively to diverse audiences using a multi-tool methodology.
- Cultivating Data Intuition: Go beyond rote memorization of functions to develop an innate sense for data quality, potential biases, and the most effective analytical paths, empowering truly data-driven decision-making.
- Future-Proofing Your Skillset: Gain proficiency in a robust trifecta of tools that remain central to the modern data landscape, ensuring your acquired skills are immediately applicable and highly sought after in evolving job markets.
- Developing Analytical Agility: Learn to seamlessly transition between different analytical environments, adapting your workflow based on project requirements and data complexity, a crucial skill for any dynamic data role.
- Building a Professional Portfolio: Create a tangible collection of diverse projects that showcase your proficiency across multiple platforms, providing concrete evidence of your capabilities to potential employers.
- Unlocking Career Pathways: Position yourself for entry-level data analyst, business intelligence analyst, or junior data scientist roles by acquiring a foundational yet comprehensive skill set highly valued across industries.
- Mastering Data Governance Fundamentals: Understand the principles of data ethics, privacy, and responsible data handling as you progress through real-world scenarios, fostering a mindful approach to data analysis.
- From Raw Data to Actionable Insights: Experience the complete lifecycle of a data project, from initial data acquisition and cleaning to sophisticated analysis and impactful visualization, readying you for real-world challenges.
- PROS:
- Comprehensive Toolset: Offers a holistic introduction to Excel, Python, and Tableau, providing a versatile skill foundation for diverse industry roles.
- Practical, Project-Driven Learning: Emphasizes hands-on application through real-world scenarios, building a demonstrable portfolio of skills.
- Accessibility for Beginners: Designed for those with no prior data science experience, breaking down complex topics into digestible modules.
- Career Accelerator: Equips learners with highly marketable technical and analytical skills, boosting employability in the rapidly growing data field.
- CONS:
- Potential for Breadth Over Depth: Covering three major tools and statistics comprehensively for beginners might limit the deep dive into advanced features or highly specialized applications of each platform.
English
language