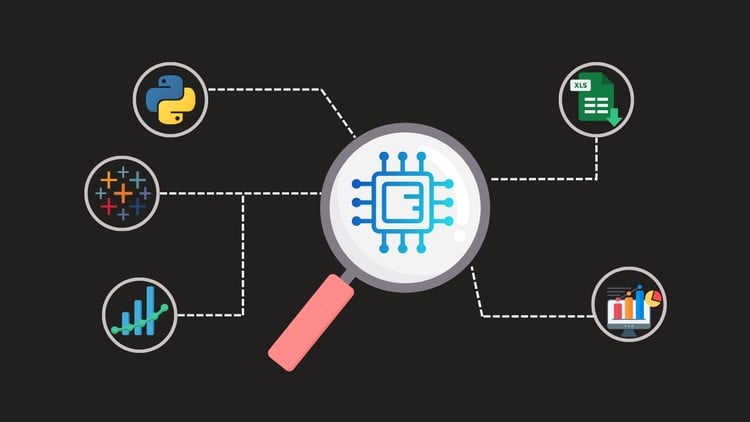
A beginner-friendly data science course covering Excel, Python, Tableau, and statistics with real-world projects.
What you will learn
Note➛ Make sure your 𝐔𝐝𝐞𝐦𝐲 cart has only this course you're going to enroll it now, Remove all other courses from the 𝐔𝐝𝐞𝐦𝐲 cart before Enrolling!
Analyze and visualize data in Excel using pivot tables and charts.
Write Python scripts for data manipulation with Pandas and NumPy.
Perform statistical analysis and hypothesis testing with ease.
Create interactive dashboards and visualizations in Tableau.
Clean, organize, and prepare datasets for analysis.
Understand key statistical concepts for data-driven decisions.
Use Python libraries like Matplotlib and Seaborn for visualization.
Integrate Excel, Python, and Tableau for seamless data workflows.
Apply real-world data analysis techniques to projects.
Build confidence as a data science professional from scratch.
English
language