Data Visualizations with POWER BI
What you will learn
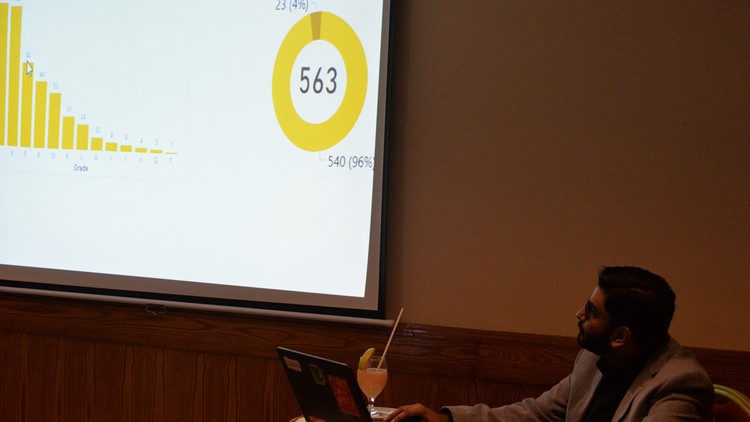
Data Visualizations
Why take this course?
Note➛ Make sure your 𝐔𝐝𝐞𝐦𝐲 cart has only this course you're going to enroll it now, Remove all other courses from the 𝐔𝐝𝐞𝐦𝐲 cart before Enrolling!
Visualizations (known as visuals for short) display insights that have been discovered in the data. A Power BI report might have a single page with one visual or it might have pages full of visuals. It’s important to make the distinction between report designers and report consumers. If you are the person building or modifying the report, then you are a designer. Designers have edit permissions to the report and its underlying dataset. In Power BI Desktop, this means you can open the dataset in Data view and create visuals in Report view.
English
language
Found It Free? Share It Fast!