Artificial Intelligence without coding, create great solutions, forecast and more
What you will learn
Machine learning
Data visualization
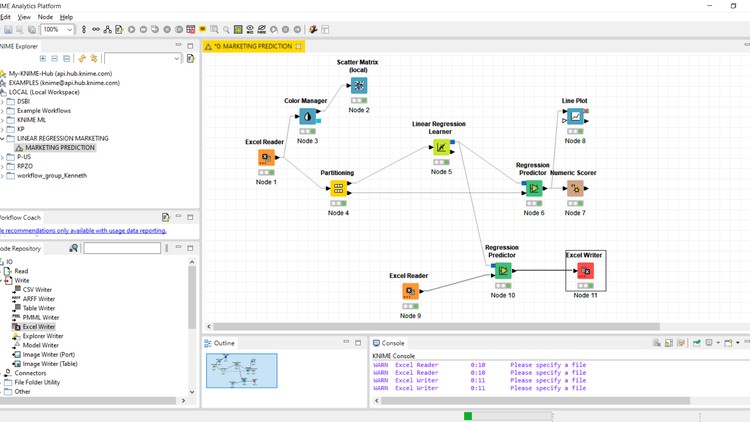
Create a workflow of machine learning algorithm
Linear regression
Description
In last couple of years, machine learning has become a fundamental tool for decision-making in the corporate world, as well as widely used in different areas, ranging from business to the purest science, allowing the computer to perform the most difficult tasks finding patterns and correlations between variables that allow through inferential statistics to make predictions based on data, which allows creating competitive advantages in various fields, taking advantage of the inputs of historical information of the company or business to find patterns and correlations that allow us to identify possible future outcomes. Under the supervised learning paradigm we will apply the concept of linear regression to project, through the equation of the line, the possible result values in relation to predictor variables and dependent variables, in which Machine Learning is able to identify the weights of importance for each one of the participating variables, its relationship with the variable of interest to be predicted and even determine if any system variable can be discarded, in order to create a model with a high level of statistical reliability that contributes to the decision-making process management, finally one of the objectives of the course is to also understand the importance of data visualization to achieve a greater understanding of the results of the model and thus identify how far or close to the actual results selected to evaluate the model we are
Content