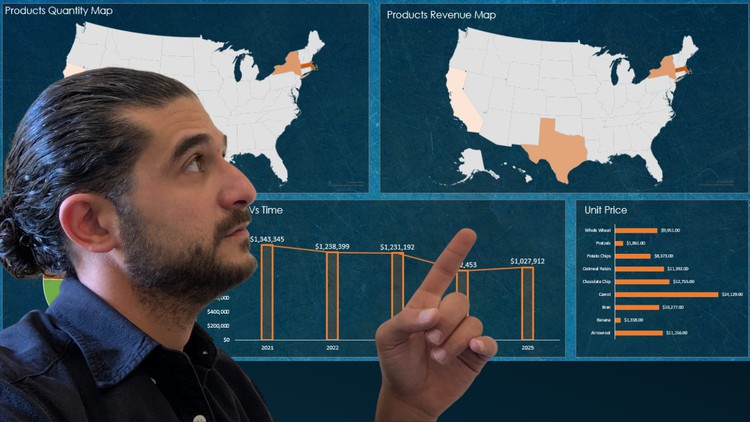
Build your Dynamic Excel Dashboard by learning Standard and Uncommon charts and Pivot Tables – Learn what matters
What you will learn
The most important thig taught in this course is that you will learn how to think excel
You will also learn few Standard charts in excel as well as uncommon charts such as infographs, dynamic line charts, shaped column charts, progress cycles etc.
You will learn how to insert and edit Pivot Tables
You will learn how to insert and edit Pivot Charts and slicers
And finally, you will learn how to creat a dynamic dashboards using features taught in this course
Description
In this course, you will learn how to use charts & pivot tables to create amazing dynamic dashboards. But to do that you must first learn the basic charts and how to insert and edit pivot tables, slicers and pivot charts which will be taught in this course as well. During that journey, you will learn additional uncommon charts that requires an out of the box thinking as they are not an excel standard charts, such as the dynamic doughnut chart, rounded edges progress donut chart, dynamic line charts, overlay image charts and much more.
This course only requires you to know the basic principles of excel as the course will guide you to do dynamic dashboards from scratch. Therefore, this course is applicable for all levels, beginners, intermediate and advanced levels in Excel.
This is your chance to enhance you sheets, it is time to stop using standard direct methods, and level up your game to use dynamic dashboards and uncommon Excel charts.
I will be using Excel 2019 but most of the features are available in the previous Excel versions.
With that being said, I can’t wait to see you inside. If you decided to join me and other thousands students all over the world, I strongly advice you to download the resources and work on them while learning. But whatever you decide, stay productive and happy learning!!
Content