Master Power BI, Data analysis, Visualization and designing Dashboard
☑ Understand the business intelligence workflow
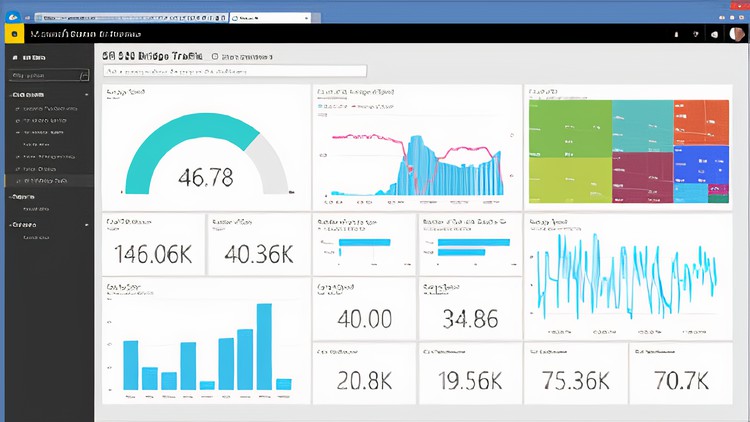
☑ Transform raw data into an interactive dashboards
☑ Build professional-quality business intelligence reports from the ground up
– Power BI is becoming the most powerful self-service business intelligence platform, and an absolutely essential tool for data professionals and beginners alike
– A comprehensive, guide to learning Microsoft Power BI Desktop.
– You can connect to hundreds of data sources, build complex relational models using simple and intuitive tools,
– You can design stunning, interactive dashboards from scratch
– You’ll Lead Business Intelligence Analyst for business case, to design and deliver a professional business intelligence solution.
– Don’t worry, I’ll be with you to get dirty with this project step – by- step
– Whether you’re a casual Power BI user, aspiring analyst, or data science professional, this course will give you the tools you need to become an absolute Power BI expert, Guaranteed
– Students will be able to comfortably work with the different tools of the Power BI universe and know how the different tools work together
Course Structure :
– Section 1 : Introduction to Data analysis and power Bi Desktop
– Section 2 : Connection and Shaping Data
– Section 3: Table Relationships and Data Model
– Section 4: Analyzing Data with DAX
– Section 5: Data Visualization with Power BI Desktop
Who this course is for:
- Data Analysts
- Excel users hoping to develop advanced data modeling, dashboard design, and business intelligence skills
- Anyone looking to pursue a career in data analysis or business intelligence
English
Language
Introduction
Introduction
2. Connection and Shaping Data
Introduction and adjusting settings in Power Bi
2-2.Transform data in power bi
2-3. Dealing with texts – Voice Problem
2-4.Dealing with numbers
2-5.Working with Date & Time
2-6.Index column and conditional column
2-7.Grouping & Aggregating
2-8. Pivot & unpivot Demo 1
2-8. Pivot & unpivot Demo 2
2-9. Merging Queries
2-10. Append Queries
2-11.Connecting a folder
2-12. Data source sitting and refreshing in report
2-13. Data type and categories in PBi
2-14. Hierarchies in PBi
3. Table Relationships and Data Model
3-1.The issue and Data model
3-2. Normalization and understand Data table & Data lookup
3-3. Creating table relationship
3-4. Snowflake schemas
3-5. Editing relationship and Active vs. Inactive relationship
3-6. Connect multiple data table
3-7. Filter flow
3-8. Bi direction ( two-way) direction filter
3-9. Hiding fields from the report view
4. Analyzing Data with DAX
4-1. Intro to DAX and calculated column
4-2. Intro to measures
4-3. Adding measures, Implicit vs. Explicit measures
4-4. DAX Date & Time function 1
4-4. DAX Date & Time function 2
4-5.DAX. IF-OR-AND functions
4-6. DAX, Common text functions
4-7. DAX , Joining Data with related
4-8. DAX, Math functions
4-9. DAX. Count functions ( Count, COUNTA, Countrows, distinctcount)
4-10. important
4-11. DAX, Calculate function
4-12. DAX, Calculate ALL
4-13. DAX, Filter
4-14. DAX, Iterator functions
4-15. DAX, Time intelligence
Data Visualization with Power BI Desktop
5-2. Basics of Visualization Data in Power BI
5-3. Formatting options
5-4. Filter Options
5-5. Explore data with Matrix
5-6. Filter Data with slicers
5-7. Cards and KPI Visuals
5-8. Text Cards
5-9. Visualizing Data with Maps
5-10. Visualizing Data with Tree maps
5-11. Trendline and Area Chart
5-12. Trendline with forecasts
5-13. Goal pacing with gauges chart
5-14. Edit Report Interactions
5-15, Drill Through Filter
5-16. Report Bookmarks
5-17. What if analysis
5-18. Managing and Viewing Roles
5-19. More visuals, Mobile Layout and PBI Service need cut