Magnitude and Phase Bode Plot
What you will learn
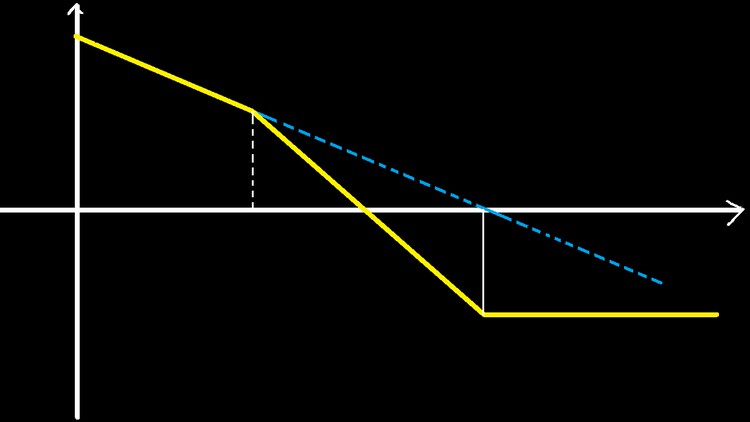
Magnitude Bode Plot
Phase Bode Plot
Phase Bode Plot of Second Order Underdamped System
Magnitude Bode Plot of Second Order Underdamped System
Gain Margin of Control System Using Bode Plot
Phase Margin of Control System Using Bode Plot
Description
This course contains magnitude Bode plot starting with zero slope, magnitude Bode plot starting with negative slope, magnitude Bode plot starting with positive slope and phase Bode plot of transfer function and the gain margin and phase margin analysis using Bode plot.
Bode plots are a very useful way to represent the gain and phase of a system as a function of frequency. This is referred to as the frequency domain behavior of a system.
Bode Plot is a useful tool that shows the gain and phase response of a given LTI system for different frequencies.
Bode magnitude and phase plots can be quickly and easily approximated by using a series of straight lines. These approximate graphs can be generated by following a few short, simple rules (listed below). Once the straight-line graph is determined, the actual Bode plot is a smooth curve that follows the straight lines, and travels through the breakpoints.
The slope of a straight line on a Bode magnitude plot is measured in units of dB/Decade, because the units on the vertical axis are dB, and the units on the horizontal axis are decades.
Bode phase plots are plots of the phase shift to an input waveform dependent on the frequency characteristics of the system input.
The Bode plot is a graphical response prediction technique that is useful for both circuit design and analysis. It is named after Hendrik Wade Bode, an American engineer known for his work in control systems theory and telecommunications. A Bode plot is, in actuality, a pair of plots: One graphs the gain of a system versus frequency, while the other details the circuit phase versus frequency. Both of these items are very important in the design of well-behaved, optimal operational amplifier circuits. Generally, Bode plots are drawn with logarithmic frequency axes, a decibel gain axis, and a phase axis in degrees.
Bode Plot is also known as the logarithmic plot as it is sketched on the logarithmic scale and represents a wide range of variation in magnitude and phase angle with respect to frequency, separately. Thus, the bode plots are sketched on semi-log graph paper.
Also, as we can see that in both the plots the logarithmic value of frequency is scaled on the x-axis, so, x-axis can be kept common and both magnitude and phase angle plots can be drawn on the same log paper.