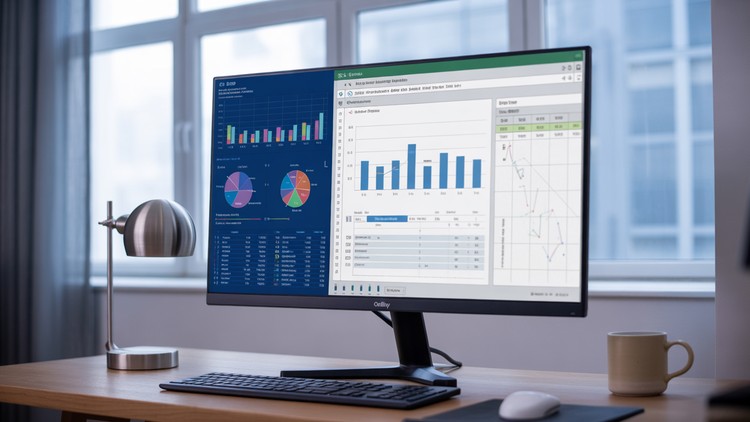
Master Excel and Power BI to create stunning project management dashboards, reports
⏱️ Length: 2.8 total hours
⭐ 4.43/5 rating
👥 7,679 students
🔄 June 2025 update
Add-On Information:
Note➛ Make sure your 𝐔𝐝𝐞𝐦𝐲 cart has only this course you're going to enroll it now, Remove all other courses from the 𝐔𝐝𝐞𝐦𝐲 cart before Enrolling!
- Course Overview
- This course fundamentally transforms how project professionals communicate complex data, moving beyond basic spreadsheets to engaging visual narratives.
- Learn to translate intricate project metrics—like budget deviations, schedule adherence, and resource allocation—into intuitive, impactful graphical reports.
- Elevate project status updates and stakeholder presentations by designing dashboards that highlight critical insights, fostering clearer communication and faster decisions.
- Grasp the strategic importance of data visualization in modern project management for proactive risk identification and performance optimization.
- Discover effective methodologies for presenting project progress, challenges, and successes to diverse audiences, from teams to executives.
- Bridge the gap between raw data and actionable intelligence, making project data a powerful guide, not just a historical record.
- Streamline project reviews through visual reporting, ensuring meetings are efficient and outcome-focused by cutting through data noise.
- Demystify the process of transforming numerical project information into persuasive visual arguments that drive engagement and secure buy-in.
- Position yourself as a data-savvy project manager capable of illuminating performance trends and forecasting future trajectories.
- Requirements / Prerequisites
- A foundational understanding of core project management concepts (e.g., scope, timeline, budget, resources) will enhance your learning.
- Basic familiarity with the Excel interface, including navigating worksheets and data entry, is recommended. No advanced Excel knowledge is presumed.
- You will need access to Microsoft Excel and the free Power BI Desktop application on your computer for all hands-on exercises.
- A strong desire to improve data presentation skills and make project information more accessible and engaging.
- No prior experience with Power BI or advanced data visualization techniques is necessary, making this course suitable for motivated beginners.
- Willingness to actively participate in practical exercises and apply new concepts to simulated project scenarios.
- A reliable internet connection is required for course access and software downloads.
- Skills Covered / Tools Used
- Mastering core principles of effective dashboard design, including optimal layout, information hierarchy, and visual consistency for user-centric reports.
- Developing impactful data storytelling techniques specifically for project management, ensuring reports convey clear, compelling narratives.
- Implementing dynamic conditional formatting rules to create visual alerts, highlighting key performance thresholds or critical statuses.
- Designing highly interactive reports that enable stakeholders to dynamically explore project data based on their specific needs and interests.
- Adopting best practices for preparing and distributing project reports across various channels: print, digital sharing, or live presentations.
- Strategic selection of the most appropriate visualization types to accurately represent specific project metrics, avoiding misinterpretation.
- Leveraging advanced slicers and timelines within dashboards to create responsive, filterable views of complex project data.
- Techniques for optimizing report performance, ensuring quick loading times and robust, often automated, data refresh capabilities.
- Cultivating an acute eye for detail in visual design, ensuring readability, accessibility, and a professional aesthetic in all communications.
- Applying robust data validation and error-checking methods to guarantee the accuracy and reliability of all reported project information.
- Benefits / Outcomes
- You will profoundly enhance your ability to communicate intricate project information with unparalleled clarity, impact, and professional polish.
- Gain a significant competitive advantage in the project management job market by mastering highly sought-after data visualization competencies.
- Dramatically reduce the manual effort and time typically consumed by compiling and formatting complex project status reports.
- Foster superior stakeholder engagement and understanding through compelling, visually appealing, and easily digestible project data presentations.
- Empower yourself and your project teams to make more confident, data-driven decisions, leading directly to improved project outcomes and reduced risks.
- Transform traditionally dry spreadsheets into dynamic, interactive visual narratives that captivate your audience and deliver insights rapidly.
- Position yourself as a more persuasive and effective project leader, adept at articulating progress, challenges, and strategic direction through powerful visuals.
- Develop the expertise to swiftly identify critical project bottlenecks, emerging risks, and new opportunities through insightful graphical analysis.
- Significantly enhance your career prospects by adding in-demand skills in business intelligence and data visualization to your professional toolkit.
- Contribute to cultivating a data-centric organizational culture, advocating for transparency and evidence-based decision-making.
- Build a practical portfolio of stunning project reports and dashboards, showcasing your newly acquired skills and capabilities.
- PROS
- Offers highly practical, job-skill oriented competencies directly applicable to professional project management.
- Utilizes industry-standard, widely adopted tools (Excel and Power BI), significantly boosting your employability.
- Directly addresses a critical need for enhanced communication and data-driven decision-making within projects.
- Its concise duration allows for efficient skill acquisition with minimal disruption to your professional schedule.
- Hands-on, project-based learning reinforces understanding and provides tangible, shareable outputs.
- Empowers project managers to transition from basic reporting to sophisticated, insightful data visualization.
- Represents excellent value for developing high-demand competencies in project analytics and business intelligence.
- CONS
- Given the very short duration (2.8 hours), achieving true “mastery” or comprehensive exploration of every advanced feature might require additional self-study and practice beyond the course content.
Learning Tracks: English,Business,Project Management
Found It Free? Share It Fast!