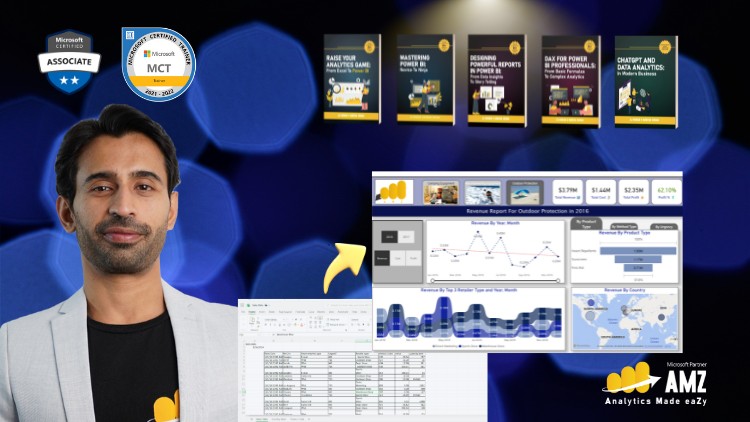
Mastering Data Analysis and Dynamic Visualizations with Microsoft Power BI – Recorded Live with Executives in Training.
What you will learn
Understand the basic features and functionalities of Power BI.
Acquire skills in importing data from various sources and transforming it for analysis.
Learn how to create simple visualizations like charts, graphs, and tables to represent data effectively.
Grasp the fundamentals of data modeling and relationships within Power BI.
Gain hands-on experience by working on practical exercises and projects that simulate real-world scenarios.
Lay the groundwork for more advanced topics in Power BI by understanding the essentials thoroughly.
Learn to publish and share report with stakeholders
Add-On Information:
Note➛ Make sure your 𝐔𝐝𝐞𝐦𝐲 cart has only this course you're going to enroll it now, Remove all other courses from the 𝐔𝐝𝐞𝐦𝐲 cart before Enrolling!
- Unlock the power of interactive dashboards that bring your data to life, moving beyond static spreadsheets.
- Bridge the gap between familiar Excel environments and the cutting-edge capabilities of business intelligence.
- Transform raw, often messy, data into clear, actionable insights with intuitive tools.
- Discover how to build dynamic reports that empower stakeholders to explore data independently and ask their own questions.
- Gain the confidence to tell compelling data stories through visually appealing and easily understandable presentations.
- Develop a foundational understanding of how to connect to and consolidate data from your existing Excel files, as well as other common sources like CSVs and cloud services.
- Learn the principles of data preparation and cleansing, ensuring the accuracy and reliability of your analytical outputs.
- Familiarize yourself with the core components of the Power BI ecosystem, including Power BI Desktop, Power BI Service, and the mobile app.
- Understand how to create meaningful relationships between different datasets to unlock deeper analytical perspectives.
- Build proficiency in designing user-friendly interfaces for your reports, making data consumption effortless for all audiences.
- Master the techniques for optimizing report performance, ensuring fast loading times and a smooth user experience.
- Explore methods for enhancing report security and managing access to sensitive information.
- Get acquainted with the concepts of key performance indicators (KPIs) and how to effectively display them.
- Prepare yourself for future learning by solidifying a robust understanding of essential BI principles within the Power BI framework.
- Gain practical experience through simulated business challenges, mirroring the demands of real-world data analysis projects.
- Learn to leverage Power BI’s collaboration features to share findings and foster data-driven decision-making across teams.
- Understand the fundamentals of data governance and how to maintain data integrity within your Power BI environment.
- Acquire the skills to proactively identify trends, patterns, and anomalies within your business data.
- Develop the ability to create custom, branded visualizations that align with your organizational identity.
- Master the process of automating report generation, saving valuable time and resources.
- PROS:
- Highly practical and directly applicable to improving existing Excel-based analysis.
- Emphasis on real-world application through executive-level scenarios.
- Provides a clear pathway from familiar tools to advanced BI.
- CONS:
- Limited exploration of DAX formulas for highly complex calculations.
English
language