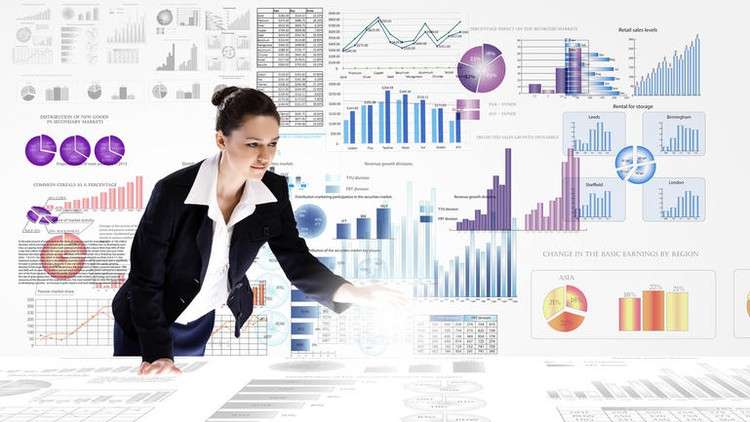
An insight into Data Visualization Concepts, Display Media, Dashboards and Design Principles.
What you will learn
Students will understand importance of Data Visualization Tool
Students will get insight of a Data Visualization Tool : Dashboard
Students will get to know Design Principles of Dashboard
Why take this course?
**Course Description:**
Welcome to the era of **#BigData**! The 21st Century is witnessing an unprecedented explosion of information in virtually every aspect of life. From science & technology to education, healthcare, e-commerce, and entertainment – the digital revolution has transformed us into a society immersed in data at all times. With this deluge of information comes the critical challenge of understanding, analyzing, and effectively communicating what the data is saying. This is where **Data Visualization** emerges as a pivotal discipline in the field of Business Intelligence.
**Why Data Visualization?**
– **Big Data Demand:** The vast amounts of data generated daily require sophisticated methods to make it comprehensible and actionable. Data visualization is key to interpreting big data trends, patterns, and insights.
– **Career Opportunities:** The rise of big data has created a demand for professionals skilled in data visualization. Roles like Data Engineer, Data Analyst, Data Scientist, and Data Visualization Consultant are on the rise, offering exciting career prospects.
– **Strategic Decision Making:** Effective data visualization enables businesses to test, redesign, and refine strategies, seize new market opportunities, and make informed and strategic decisions.
**What You’ll Learn in This Course:**
1. **Mastering Data Visualization Concepts:** Gain a solid understanding of the core principles that govern data visualization. Learn how to translate complex data into compelling visual narratives.
2. **Exploring Display Media:** Dive into the various display media used for data representation, including tables, charts, graphs, and maps. Understand each medium’s strengths and best use cases.
3. **Designing Effective Dashboards:** Discover the elements of an effective dashboard design and how to present data in a way that is both insightful and accessible to stakeholders at various levels of technical expertise.
4. **Applying Design Principles:** Learn the critical principles of visual design, including color theory, typography, and layout, to create visually appealing and informative data visualizations.
5. **Tool Proficiency:** Get hands-on experience with popular data visualization tools that will empower you to create dynamic and interactive visualizations.
6. **Real-World Application:** Engage with real-world case studies to see how leading organizations leverage data visualization for competitive advantage and operational efficiency.
**Course Features:**
– **Interactive Learning Modules:** Engage with content that combines theory with practical exercises.
– **Expert Led by Rupali Kulkarni:** Learn from an industry expert with extensive experience in data visualization.
– **Hands-On Projects:** Apply your skills to real-world datasets and projects.
– **Peer Collaboration:** Join a community of like-minded learners who are as passionate about data as you are.
– **Flexible Learning Schedule:** Study at your own pace, from anywhere in the world.
**Who is this course for?**
– Aspiring Data Visualization Consultants and Engineers
– Current and aspiring Data Analysts and Data Scientists
– Professionals looking to add data visualization skills to their repertoire
– Anyone with a creative and analytical mind who has an interest in computer science, statistics, and data analysis
Embark on your journey to becoming a data visualization expert today and unlock the power of data to transform business intelligence. Enroll now and take the first step towards a future where data not only talks but also tells its story through compelling visuals! 🚀
—