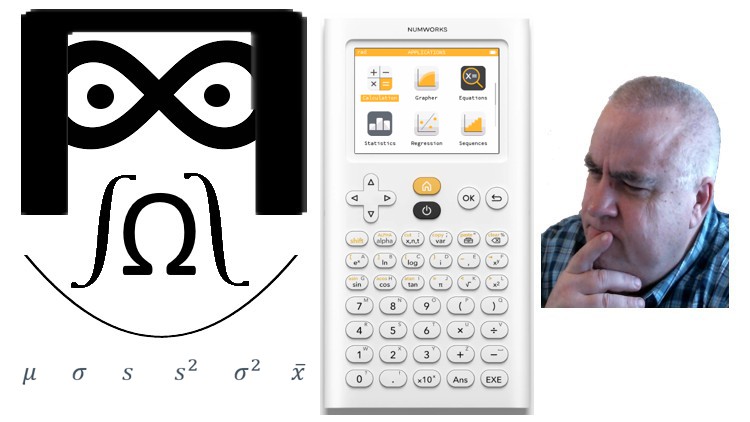
Descriptive Statistics, Probability Models, Discrete Distributions, Normal Distributions, and Central Limit Theorem
What you will learn
Perform descriptive statistics on the calculator
Work with discrete models on the calculator
Work with discrete distributions including binomial and Poisson on the calculator
Work with normal distributions on the calculator
Work with the Central Limit Theorem on the calculator
Work with regression topics on the calculator
Description
This course is meant to give the learner a solid foundation in the NumWorks Calculator for success in a Statistics course. Statistics (by hand) was the hardest course that I took in college. The formulas are not hard but if you give me 20 sets of numbers to add together (for example) then I will transpose numbers at some point. My instructor did not give partial credit on tests so my tests were quite low. I managed to get a C in the course. I started teaching statistics in the same manner that I learned it…by hand! The college where I worked started indicating that I should be using technology and I have fully embraced it for statistics ever since. It takes the mundane calculations out of the topics and allows the students to focus on the meaning of the topics.
The NumWorks Calculator has reduced the difficulty of Statistics by perhaps 75% from the “Dark Ages” of taking Statistics! The usage of these calculators has not lowered the rigor but allows students to focus more on the applications and challenging parts of the course. Students no longer have to do some of the mundane mathematical calculations.
This course covers descriptive statistics, probability models, discrete distributions (binomial and Poisson), normal distributions, and the Central Limit Theorem. These are not the only important topics but with limited time, I chose these items for this course. In this course, the NumWorks Calculator is covered. Many students come into a statistics class that requires a TI-83 or TI-84 and they are quite lost in the course. The NumWorks Calculator is radically different than the TI-83 or TI-84. The buttons and menus are not the same and cannot easily be found by most students.
Technology has become an important component of mathematics. Even if you are in a class that does not allow a NumWorks Calculator, you can use it to double-check your work by hand.
This course covers just the important parts of the NumWorks Calculator for usage in Statistics. There are many other features that are not covered. If you decide to take the course, good luck with it and the future statistics course that you are planning on taking!
Content