One who is strating with Technical analysis should go for this course.
☑ Start Scratching with the tools
☑ Common sense of Technical analysis(Price action)
☑ Price behavior
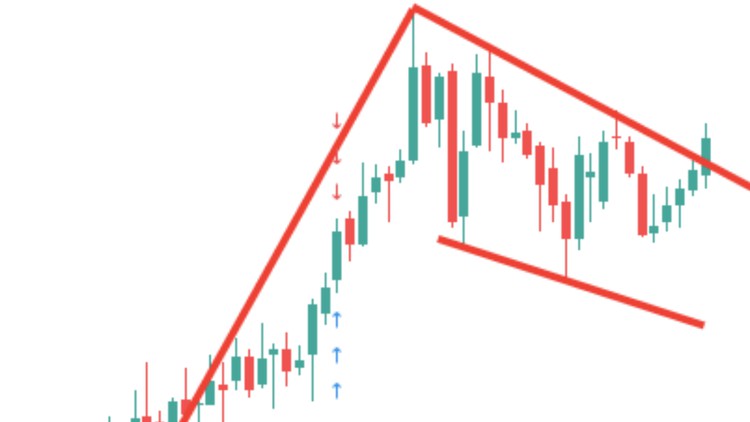
☑ How to efficiently mark a Trend-line
☑ Horizontal trend-line VS diagonal trend-lines
☑ Trade using trend line with confirmation signals
Technical analysis is a trading discipline employed to evaluate investments and identify trading opportunities by analysing statistical trends gathered from trading activity, such as price movement and volume. Technical analysts believe past trading activity and price changes of a security can be valuable indicators of the security’s future price movements. Technical analysis may be contrasted with fundamental analysis, which focuses on a company’s financials rather than historical price patterns or stock trends. Unlike fundamental analysis, which attempts to evaluate a security’s value based on business results such as sales and earnings, technical analysis focuses on the study of price and volume. Technical analysis tools are used to scrutinise the ways supply and demand for a security will affect changes in price, volume and implied volatility. Technical analysis is often used to generate short-term trading signals from various charting tools, but can also help improve the evaluation of a security’s strength or weakness relative to the broader market or one of its sectors. This information helps analysts improve their overall valuation estimate.
Technical analysis can be used on any security with historical trading data. This includes stocks, futures, commodities, fixed-income, currencies, and other securities. In this tutorial, we’ll usually analyse stocks in our examples, but keep in mind that these concepts can be applied to any type of security. In fact, technical analysis is far more prevalent in commodities and forex markets where traders focus on short-term price movements. Technical analysis as we know it today was first introduced by Charles Dow and the Dow Theory in the late 1800s.1 Several noteworthy researchers including William P. Hamilton, Robert Rhea, Edson Gould, and John Magee further contributed to Dow Theory concepts helping to form its basis. In modern day, technical analysis has evolved to included hundreds of patterns and signals developed through years of research.
This course would help you understand the basics of Technical analysis like getting onto charts, types of charts, drawing trend etc.
English
Language
Start Scratching with the tools
The workspace for the rest of your life!
Know your Chart
Line VS Candlesticks
Candlesticks Anatomy
Engulfing
Rules
Doji
Trendlines
Draw a trend line