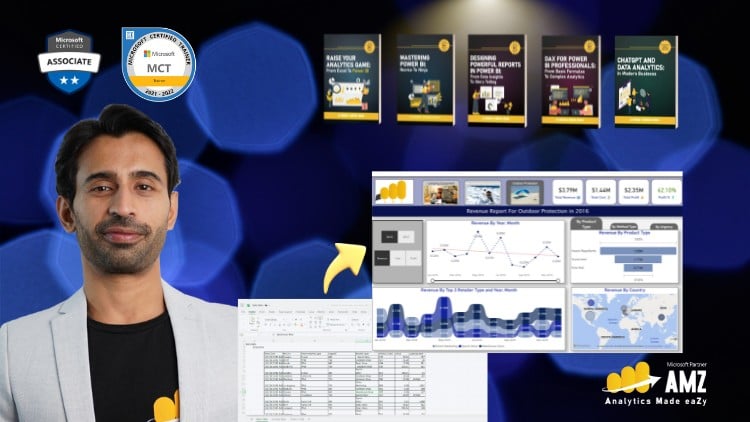
Mastering Data Analysis and Dynamic Visualizations with Microsoft Power BI – Recorded Live with Executives in Training.
⏱️ Length: 4.5 total hours
⭐ 4.49/5 rating
👥 26,992 students
🔄 September 2025 update
Add-On Information:
Note➛ Make sure your 𝐔𝐝𝐞𝐦𝐲 cart has only this course you're going to enroll it now, Remove all other courses from the 𝐔𝐝𝐞𝐦𝐲 cart before Enrolling!
- Course Overview
- Embark on a transformative journey from Excel proficiency to the dynamic world of business intelligence with Microsoft Power BI for Beginners & Excel Users.
- This comprehensive, recorded live training, designed for executives in development, demystifies data analysis and empowers you to craft compelling, interactive reports.
- Leveraging your existing Excel knowledge as a springboard, this course bridges the gap to sophisticated data visualization and actionable insights.
- With a substantial student base and a high rating, this program offers proven educational value for those looking to elevate their data storytelling capabilities.
- The 4.5-hour curriculum is meticulously structured to provide a solid foundation, ensuring you’re well-equipped to handle your organization’s data challenges effectively.
- The September 2025 update guarantees you’re learning with the most current Power BI features and best practices available.
- Discover how to move beyond static spreadsheets and create dashboards that breathe life into your data, driving informed decision-making.
- This course is more than just a tutorial; it’s an investment in your professional growth, enhancing your ability to communicate complex data narratives with clarity and impact.
- Learn to transform raw data into a strategic asset, enabling you to identify trends, uncover opportunities, and mitigate risks with confidence.
- The intimate, live-recorded format provides a unique learning experience, offering insights into how experienced professionals approach data challenges.
- You’ll gain a practical understanding of the Power BI ecosystem, enabling you to confidently navigate its features and functionalities.
- This program is designed to build your confidence in approaching new data sets and analytical tasks.
- Understand the core principles that underpin effective data analysis, laying the groundwork for continuous learning and skill development.
- Requirements / Prerequisites
- A foundational understanding of Microsoft Excel, including familiarity with basic functions, formulas, and data organization.
- A willingness to explore new software and analytical paradigms beyond traditional spreadsheet methods.
- A computer with an internet connection capable of running the Power BI Desktop application.
- Access to a Microsoft account to download and use Power BI Desktop.
- An analytical mindset and a desire to extract meaningful insights from data.
- No prior experience with business intelligence tools or advanced data modeling is necessary.
- Curiosity and an open mind to learn a powerful new analytical tool.
- Skills Covered / Tools Used
- Proficiency in navigating and utilizing the Power BI Desktop interface.
- Skills in data ingestion from diverse origins such as Excel files, databases, and cloud services.
- Techniques for data cleansing, shaping, and transformation using Power Query (M language implicitly).
- The ability to construct a coherent data model, understanding the importance of relationships between different data tables.
- Development of interactive dashboards and reports that facilitate exploration and discovery.
- Introduction to the foundational concepts of DAX (Data Analysis Expressions) for creating calculated columns and measures.
- Understanding of visual best practices for chart and graph selection to convey data effectively.
- Publication and sharing of Power BI reports to the Power BI Service for broader accessibility.
- Basic principles of report design for clarity and user engagement.
- Developing a strategic approach to data presentation.
- Problem-solving techniques applied to real-world data scenarios.
- Benefits / Outcomes
- Empowerment to independently analyze and interpret business data, moving beyond relying on IT departments or external analysts.
- The ability to create professional, dynamic, and visually appealing reports that enhance stakeholder communication and understanding.
- A significant boost in your professional value and marketability by acquiring in-demand data analysis skills.
- Increased efficiency in your daily tasks through automated reporting and streamlined data insights.
- The confidence to present data-driven findings in meetings and strategic discussions, influencing decisions effectively.
- A solid platform for further specialization in advanced Power BI features and data science.
- Reduced reliance on manual report generation, freeing up time for higher-value strategic thinking.
- The capacity to identify trends, patterns, and anomalies within your data that might otherwise go unnoticed.
- Become a more strategic thinker by understanding how data can drive business outcomes.
- Foster a data-driven culture within your team or organization.
- Gain a competitive edge by leveraging data for better business performance.
- Unlock new insights that can lead to cost savings, revenue growth, and improved operational efficiency.
- PROS
- Leverages Existing Skills: Builds directly on Excel knowledge, making the transition smoother for Excel users.
- Practical Application: Focuses on real-world scenarios and hands-on exercises, ensuring immediate applicability.
- Executive-Focused Learning: Recorded live with executives, offering insights into professional data interpretation and presentation.
- High Student Engagement: A large student base and excellent rating indicate a successful and valuable learning experience.
- Up-to-Date Content: September 2025 update ensures relevance and use of current features.
- Foundation for Growth: Establishes a strong base for exploring more advanced Power BI functionalities.
- CONS
- Beginner Focus: May be too basic for individuals with prior experience in data visualization or BI tools.
Learning Tracks: English,IT & Software,Other IT & Software
Found It Free? Share It Fast!